Full Report
The numbers behind The Cigna Group: as-reported financial statements and company metrics for FY2021–FY2025, traced to the source filings, opened with the share-price history those statements have to justify. Every linked figure opens the exact page of the filing it was printed on, with the statement row highlighted. Amounts in US$ millions unless noted.
Reading notes: company.json leaves fiscal_year_end blank; The Cigna Group reports on a December 31 calendar-year basis. FY2025 and FY2024 columns are cited to the FY2025 Form 10-K (which prints FY2025/FY2024/FY2023 for the income and cash-flow statements and FY2025/FY2024 for the balance sheet). FY2023 and FY2022 columns are cited to the FY2023 Form 10-K; FY2021 income-statement and cash-flow figures are the LDTI-restated comparative column of the FY2023 Form 10-K. The FY2021 balance sheet column is taken from the FY2021 Form 10-K on the pre-LDTI basis — no LDTI-restated FY2021 balance sheet is printed anywhere in the corpus (the FY2023 10-K balance sheet shows only FY2023 and FY2022). FY2021/FY2022 income and cash-flow figures are restated; treat the FY2021 balance sheet as on a slightly different (pre-LDTI) basis.
Share Price — Full Available History — 37 Years
The stock closed at $284.85 on Jul 22, 2026 — up 4,158% over the window shown (+10.8% a year), trading between $3.74 and $366.85. At that close the stock trades at 13× FY2025 diluted EPS as reported below.
Source: market price feed, monthly closes, sampled from 9,206 source observations, Jan 1990–Jul 2026. Price return only, excludes dividends.
Market capitalization $74.0bn.
Market cap = 259.6M shares outstanding × the Jul 22, 2026 close of $284.85. Market-derived, shown without filing links.
FY2025 at a Glance
Revenue (US$ millions)
Net income (US$ millions)
Diluted EPS
Source: FY2025 consolidated statements [1] [2]. Click any linked figure to open the filing page with the row highlighted.
Total Revenues by Segment
| Total Revenues by Segment | FY2021 | FY2022 | FY2023 | FY2024 | FY2025 |
|---|---|---|---|---|---|
| Evernorth Health Services | 131,912 | 140,335 | 153,499 | 201,973 | 234,953 |
| Cigna Healthcare | 44,643 | 44,911 | 51,148 | 53,118 | 47,412 |
| Other Operations | 3,989 | 2,263 | 596 | 828 | 674 |
| Corporate and Eliminations | (6,475) | (6,991) | (9,978) | (8,798) | (8,139) |
| Total revenues | 174,069 | 180,518 | 195,265 | 247,121 | 274,900 |
| Total revenues growth, derived | — | +3.7% | +8.2% | +26.6% | +11.2% |
Source: Note to the Consolidated Financial Statements — Segment Information (total revenues by reportable segment) [3] [4] [5] [6]. Click any linked figure to open the filing page with the row highlighted.
Segment Pre-Tax Adjusted Income from Operations
| Segment Pre-Tax Adjusted Income from Operations | FY2021 | FY2022 | FY2023 | FY2024 | FY2025 |
|---|---|---|---|---|---|
| Evernorth Health Services | 5,818 | 6,127 | 6,442 | 7,001 | 7,221 |
| Cigna Healthcare | 3,601 | 4,099 | 4,478 | 4,229 | 4,153 |
| Other Operations | 903 | 509 | 96 | (9) | 89 |
| Corporate and Eliminations | (1,339) | (1,466) | (1,698) | (1,688) | (1,593) |
| Total pre-tax adjusted income from operations | 8,983 | 9,269 | 9,318 | 9,533 | 9,870 |
Source: Note to the Consolidated Financial Statements — Segment Information (pre-tax adjusted income (loss) from operations) [3] [4] [5] [6]. Click any linked figure to open the filing page with the row highlighted.
Income Statement
Source: Consolidated Statements of Income [1] [2]. Click any linked figure to open the filing page with the row highlighted.
Columns marked E are consensus analyst estimates from S&P Capital IQ (CapIQ), shown alongside reported results for direct comparison; they are not company guidance.
Estimate source: S&P Capital IQ (CapIQ) consensus, as of 2026-07-22. Estimate figures are S&P Capital IQ consensus (vendor data — no filing page links). EPS and net income use the normalized (adjusted) consensus where the street reports it. Line-item analyst models (segments, drivers, KPIs) are in the Visible Alpha tab.
Balance Sheet
Source: Consolidated Balance Sheets [7] [8] [9]. Click any linked figure to open the filing page with the row highlighted.
Cash Flow
Source: Consolidated Statements of Cash Flows [10] [11]. Click any linked figure to open the filing page with the row highlighted.
Cigna Healthcare — Insurance Operating Metrics
| Cigna Healthcare — Insurance Operating Metrics | FY2021 | FY2022 | FY2023 | FY2024 | FY2025 |
|---|---|---|---|---|---|
| Total medical customers (thousands) | 17,081 | 18,004 | 19,780 | 19,147 | 18,118 |
| Insured medical customers (thousands) | 4,757 | 4,756 | 5,464 | 5,064 | 3,808 |
| Administrative services only (ASO) customers (thousands) | 12,324 | 13,248 | 14,316 | 14,083 | 14,310 |
| Medical care ratio | 84.0% | 81.7% | 81.3% | 83.2% | 84.4% |
| Cigna Healthcare pre-tax adjusted margin | 8.1% | 9.1% | 8.7% | 8.0% | 8.8% |
Source: company filings [12] [13] [14]. Click any linked figure to open the filing page with the row highlighted.
Evernorth Health Services — Pharmacy Services Metrics
| Evernorth Health Services — Pharmacy Services Metrics | FY2021 | FY2022 | FY2023 | FY2024 | FY2025 |
|---|---|---|---|---|---|
| Pharmacy claim volume / adjusted scripts (millions) | 1,638 | 1,575 | 1,585 | 2,120 | 2,222 |
| Evernorth pre-tax adjusted margin | 4.4% | 4.4% | 4.2% | 3.5% | 3.1% |
| Evernorth SG A / adjusted expense ratio | 1.9% | 2.0% | 2.2% | 1.9% | 1.8% |
Source: company filings [15] [16] [17]. Click any linked figure to open the filing page with the row highlighted.
Consolidated Earnings, Dividends Leverage
| Consolidated Earnings, Dividends Leverage | FY2021 | FY2022 | FY2023 | FY2024 | FY2025 |
|---|---|---|---|---|---|
| Adjusted income from operations (after-tax) | 6,982 | 7,313 | 7,448 | 7,741 | 8,014 |
| Adjusted income from operations per share (diluted) | 20.48 | 23.36 | 25.09 | 27.33 | 29.84 |
| Dividends declared per share | 1.00 | 1.12 | 1.23 | 1.40 | 1.51 |
| Debt-to-capitalization ratio | 41.7% | 41.0% | 40.1% | 43.8% | 43.0% |
Source: company filings [18] [19] [20] [21]. Click any linked figure to open the filing page with the row highlighted.
Long-Term Record
| Fiscal year | Total revenue | Shareholders' net income | Diluted earnings per share | Net cash from operating activities | Total shareholders' equity |
|---|---|---|---|---|---|
| FY2016 | 39,838 | — | — | — | — |
| FY2017 | 41,806 | — | — | — | — |
| FY2018 | 48,650 | — | — | — | — |
| FY2019 | 153,566 | 5,104 | 13.44 | 9,485 | — |
| FY2020 | 160,401 | 8,458 | 22.96 | 10,350 | 50,321 |
| FY2021 | 174,069 | 5,370 | 15.75 | 7,191 | 47,112 |
| FY2022 | 180,518 | 6,704 | 21.41 | 8,656 | 44,675 |
| FY2023 | 195,265 | 5,164 | 17.39 | 11,813 | 46,223 |
| FY2024 | 247,121 | 3,434 | 12.12 | 10,363 | 41,033 |
| FY2025 | 274,900 | 5,957 | 22.18 | 9,601 | 41,713 |
Source: consolidated statements across filings; older years from the standardized feed [10] [7] [1] [11]. Click any linked figure to open the filing page with the row highlighted.
Analyst Consensus
Mean target
Median target
High target
Low target
Street ratings: 15 strong buy, 5 buy, 4 hold. Consensus: Buy.
Estimate source: S&P Capital IQ (CapIQ) consensus, as of 2026-07-22. Estimate figures are S&P Capital IQ consensus (vendor data — no filing page links). EPS and net income use the normalized (adjusted) consensus where the street reports it. Line-item analyst models (segments, drivers, KPIs) are in the Visible Alpha tab.
Traceability
369 of 372 figures on this page (99%) link to the filing page where they are printed — click a linked figure to open the source PDF at that page with the row highlighted. Unlinked figures come from standardized data feeds or pre-filing years.
company.json leaves fiscal_year_end blank; The Cigna Group reports on a December 31 calendar-year basis.
FY2025 and FY2024 columns are cited to the FY2025 Form 10-K (which prints FY2025/FY2024/FY2023 for the income and cash-flow statements and FY2025/FY2024 for the balance sheet).
FY2023 and FY2022 columns are cited to the FY2023 Form 10-K; FY2021 income-statement and cash-flow figures are the LDTI-restated comparative column of the FY2023 Form 10-K.
The FY2021 balance sheet column is taken from the FY2021 Form 10-K on the pre-LDTI basis — no LDTI-restated FY2021 balance sheet is printed anywhere in the corpus (the FY2023 10-K balance sheet shows only FY2023 and FY2022). FY2021/FY2022 income and cash-flow figures are restated; treat the FY2021 balance sheet as on a slightly different (pre-LDTI) basis.
Revenue breakdown and segment profit use Cigna's reported segment structure (Evernorth Health Services, Cigna Healthcare, Other Operations, Corporate and Eliminations). FY2021–FY2022 segment figures are the recast comparatives disclosed in the FY2023 10-K segment footnote; the FY2025 10-K segment footnote is presented under ASU 2023-07 with pre-tax adjusted income (loss) from operations as the segment profit measure.
FY2016–FY2018 long-term figures (Cigna Corporation, before the December 2018 Express Scripts acquisition) come from the standardized SEC XBRL data feed and are shown without page links; net income and diluted EPS are not available in the feed for those years. The step-up in total revenue from FY2018 (~48.7bn) to FY2019 (153.6bn) reflects the Express Scripts acquisition.
Quarterly income-statement and balance-sheet cells are taken directly from the printed 10-Q statements (single-quarter/three-month income columns; point-in-time balance sheets). Quarterly cash-flow single quarters are derived from the printed year-to-date statements and cross-check exactly to data/financials/cash_flow_quarterly.json (Q2 FY25 operating cash flow -1,886; Q3 FY25 3,418). A Q4 FY25 quarter is omitted because no separate Q4 statement is filed (Q4 data is the FY2025 annual).
3 figure(s) differed between the data feed and the filing; the filing value is shown (see the run's metrics/metrics_tab.json for the audit trail).
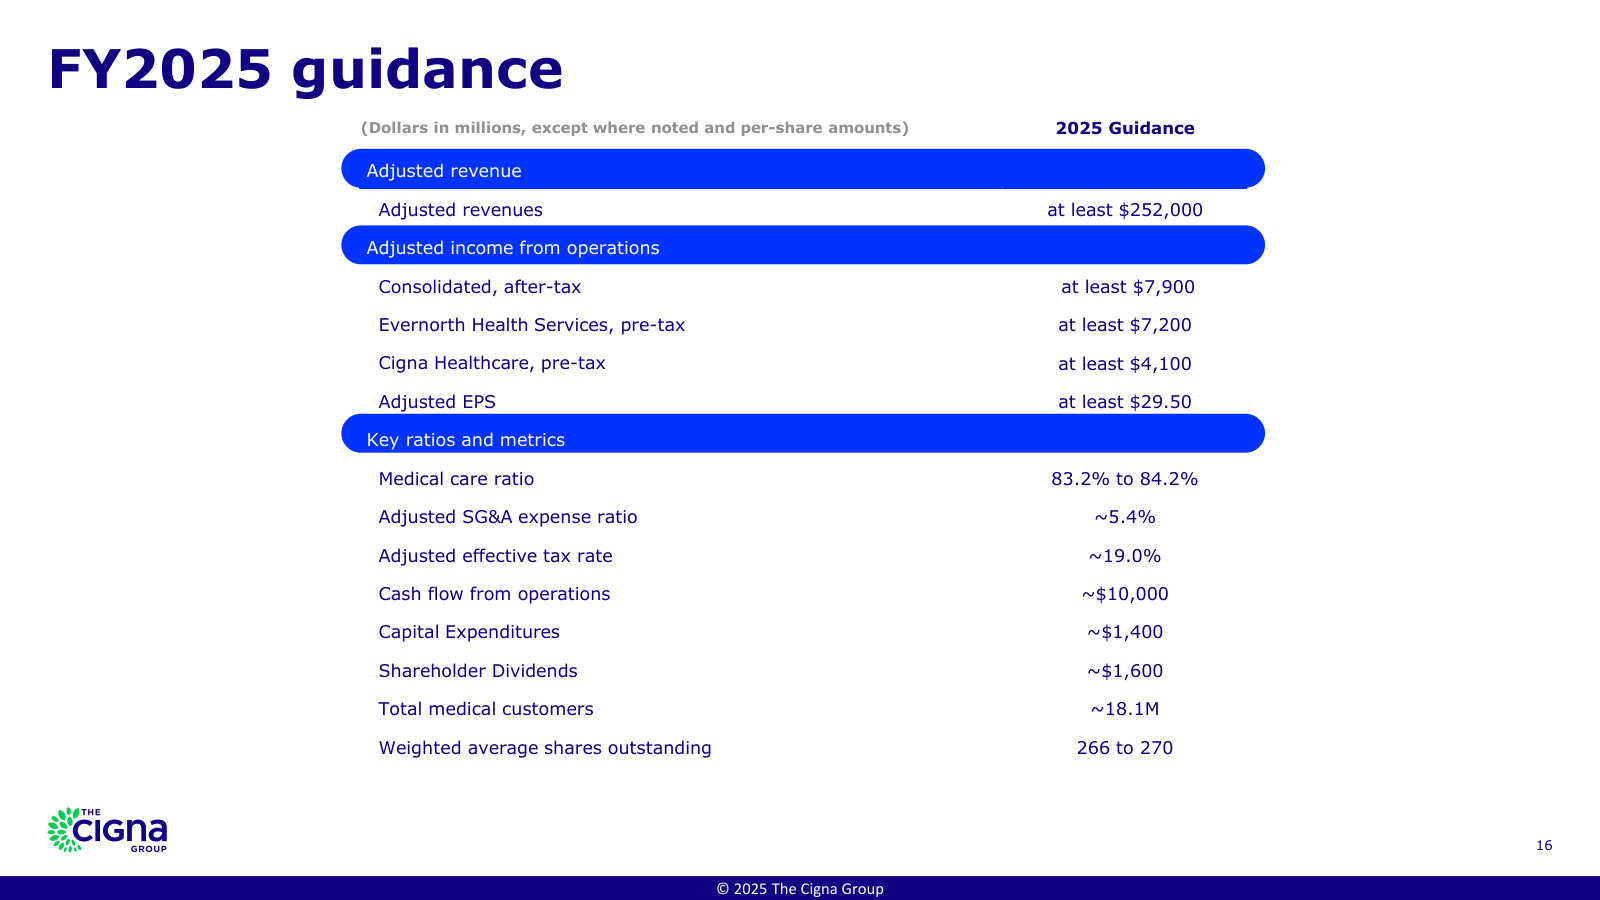
The Cigna Group's management explains the business in its own materials. The slides below do the most of that work, pulled from the documents preserved in Sources. Each source link opens the complete presentation at that slide in a new tab.
Investor Presentation — January 2025 — Q4 / FY2024
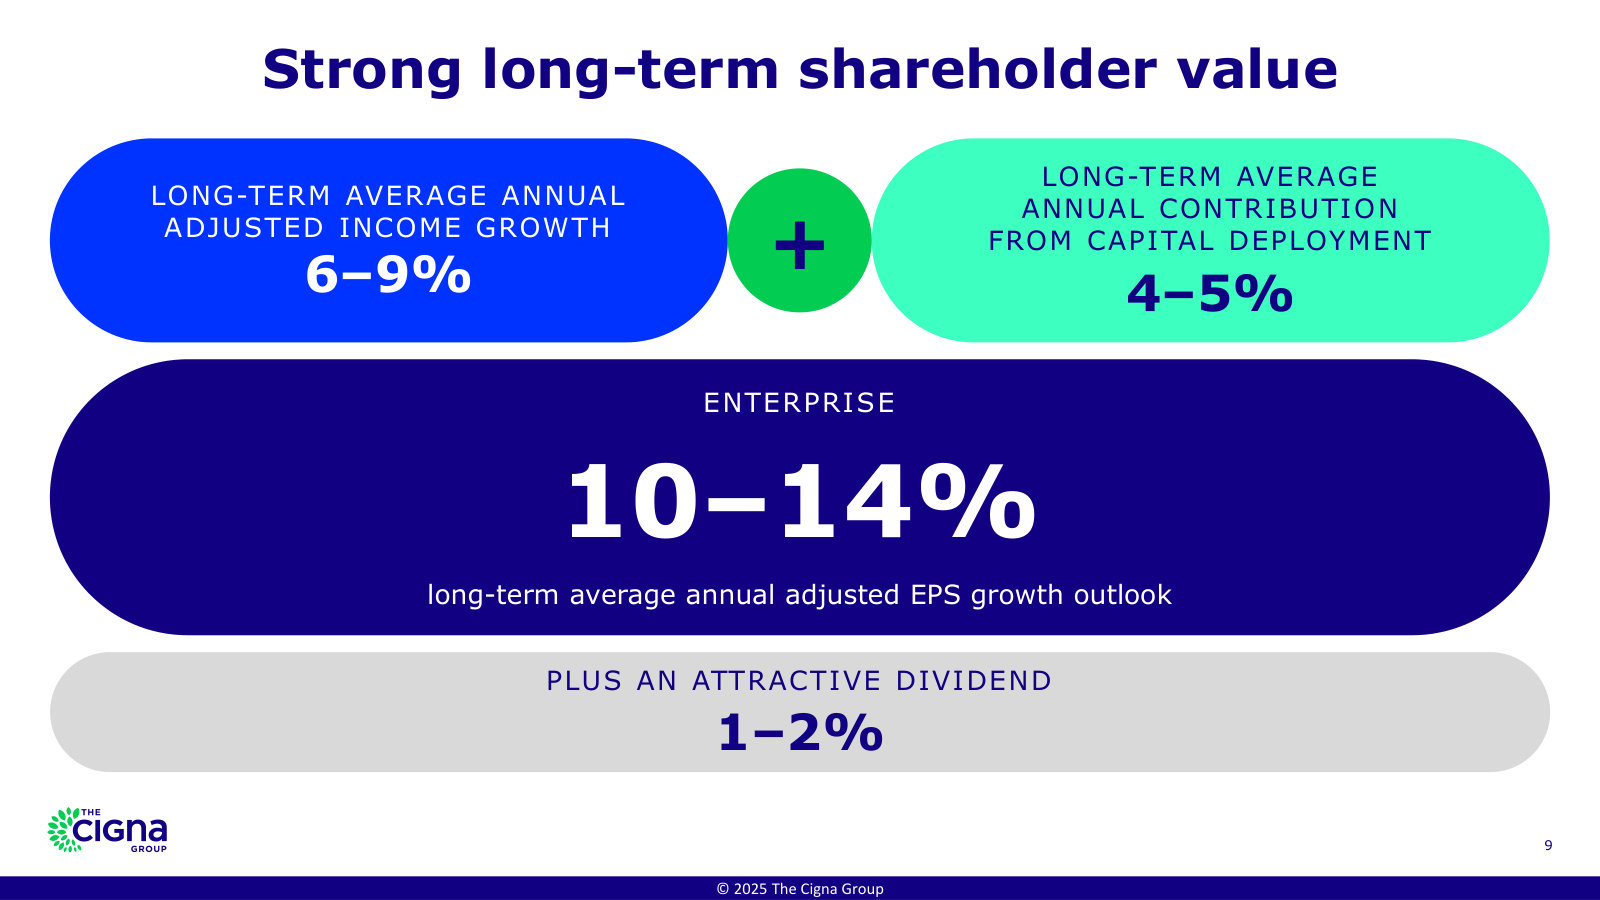
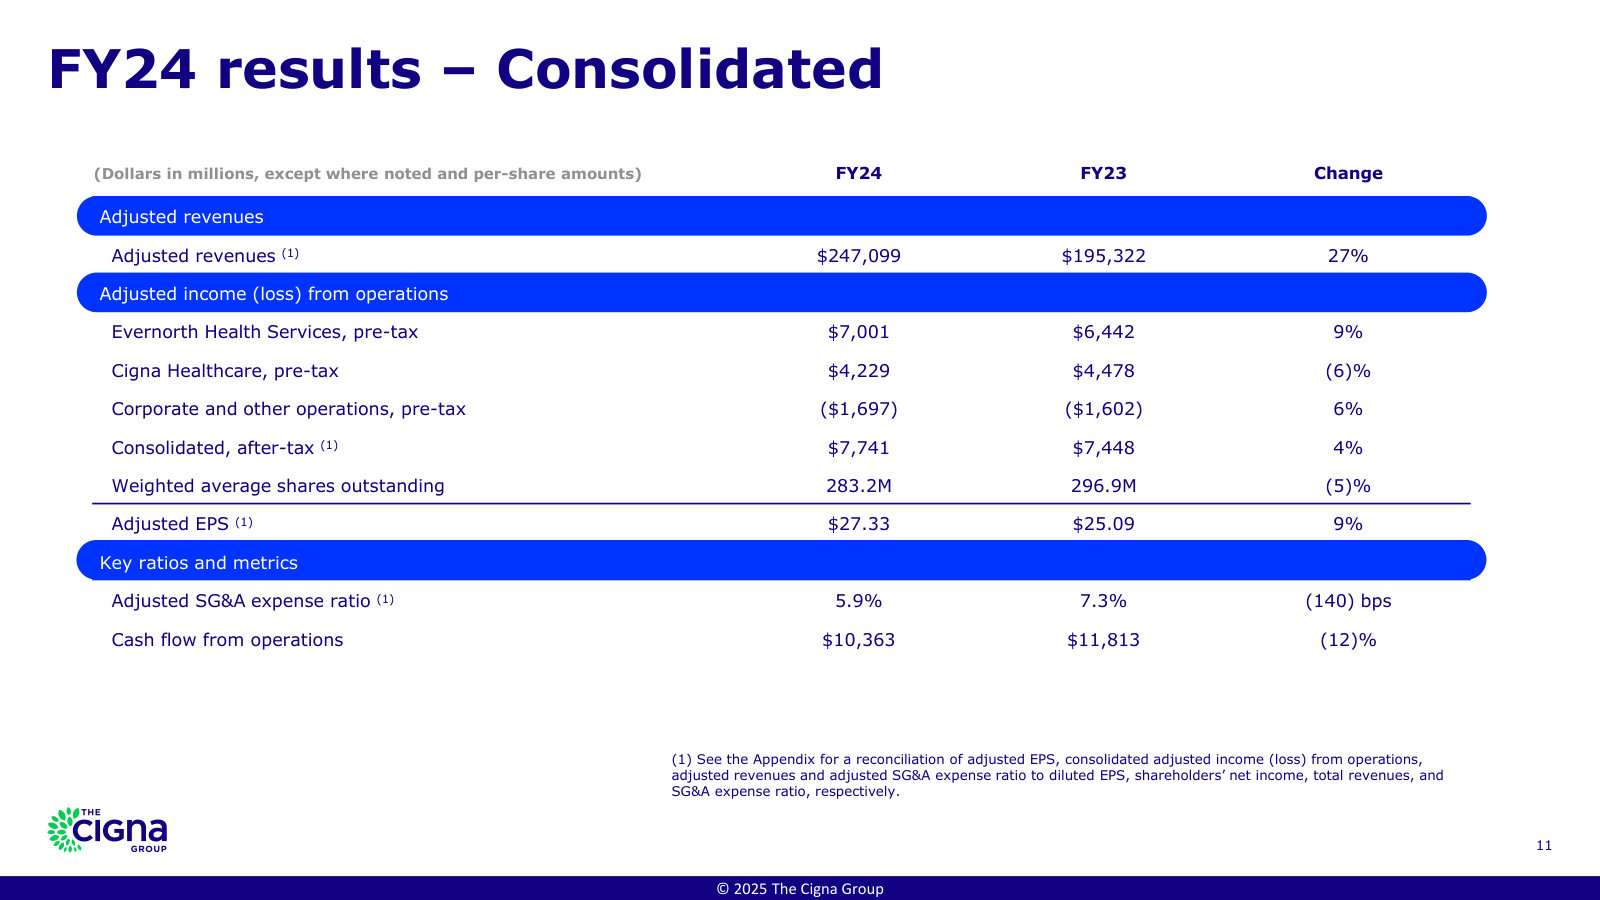
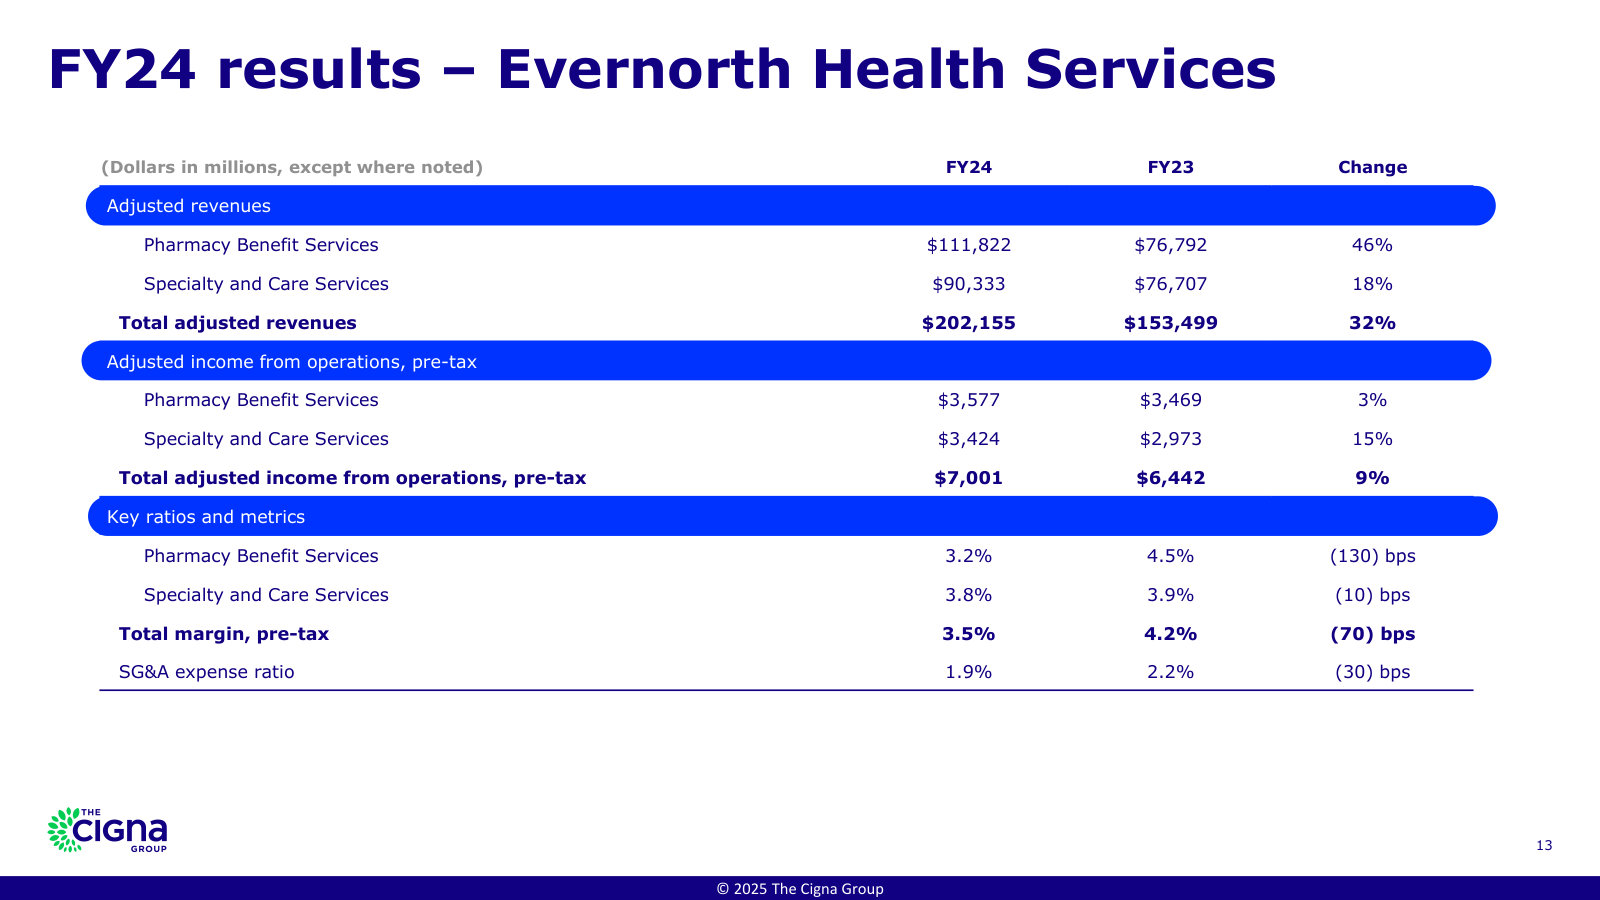
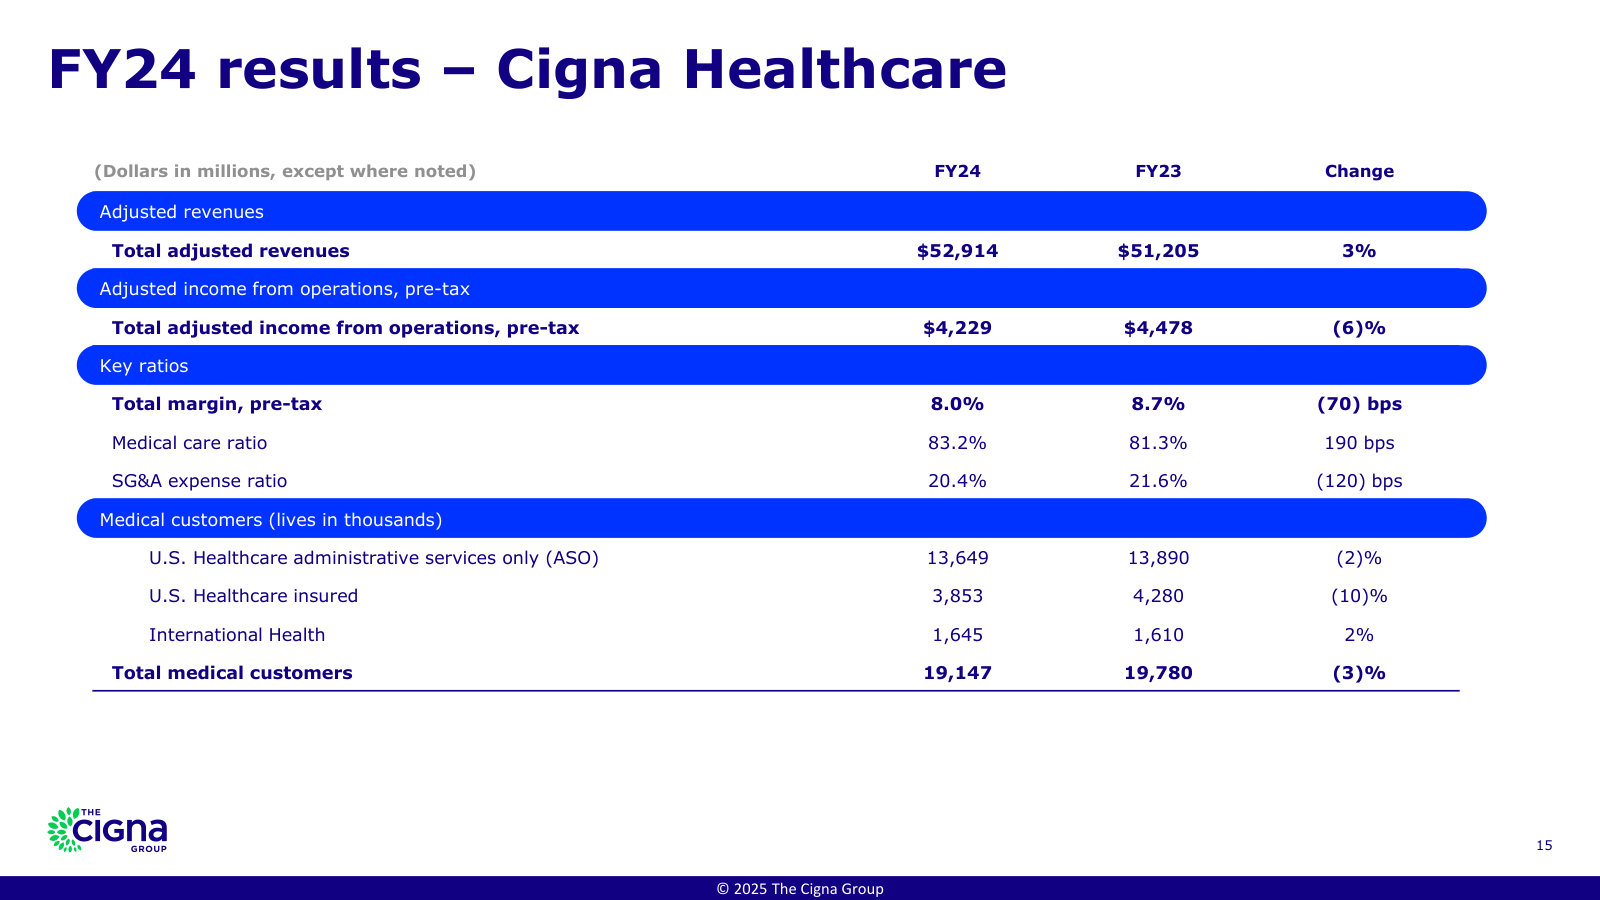
The latest, fullest deck: two-platform structure, the earnings algorithm, FY2024 segment results and FY2025 guidance. · Open the full document →
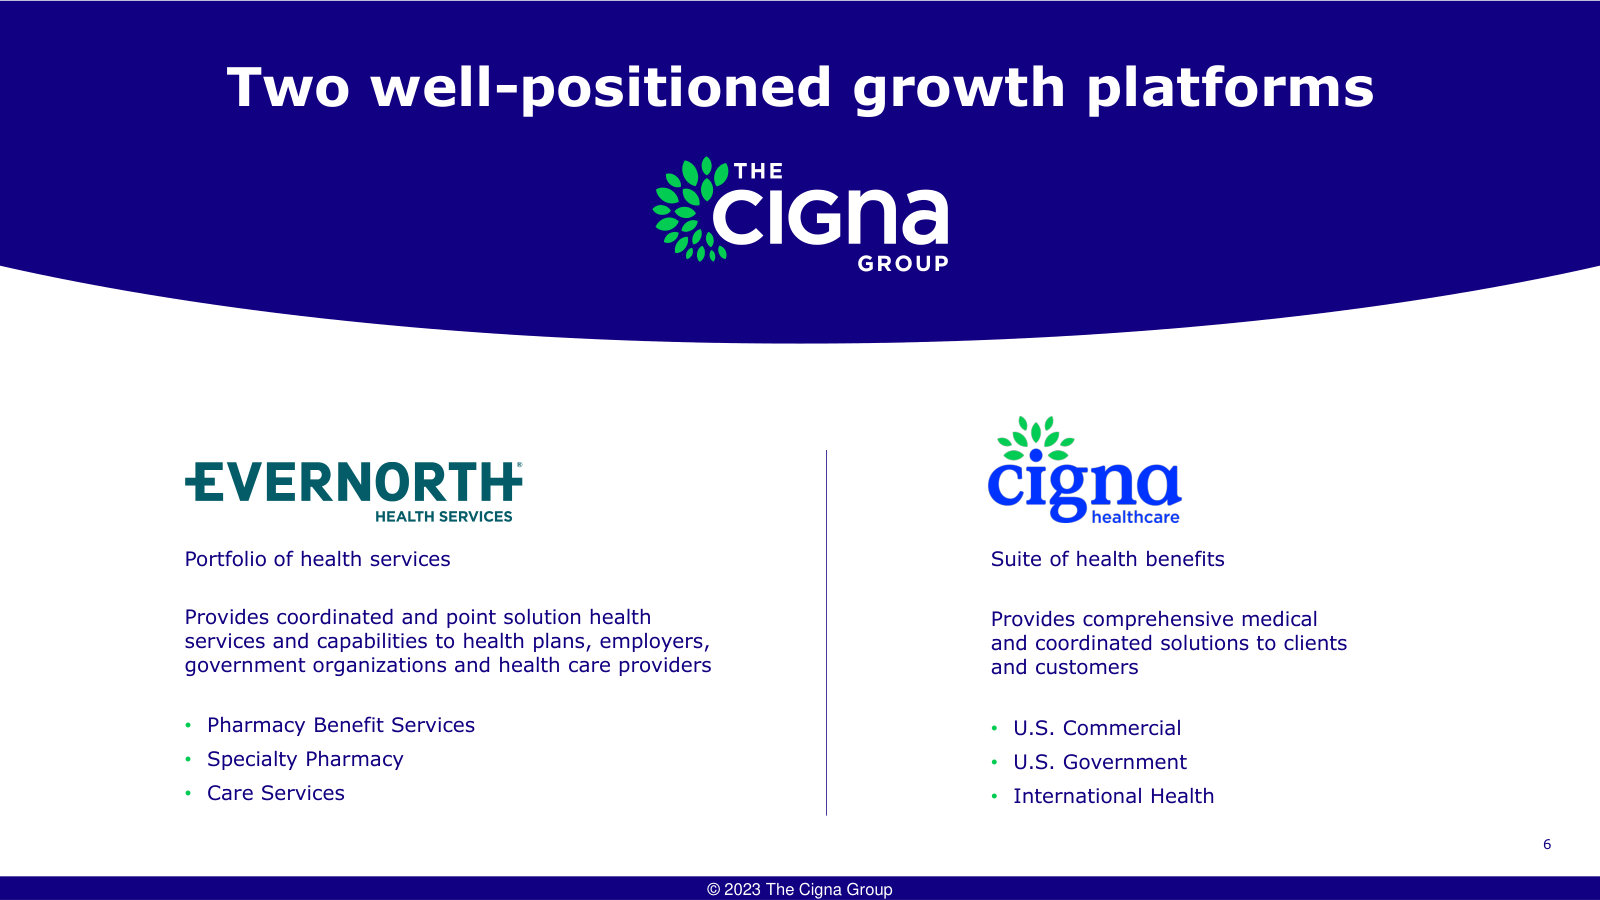
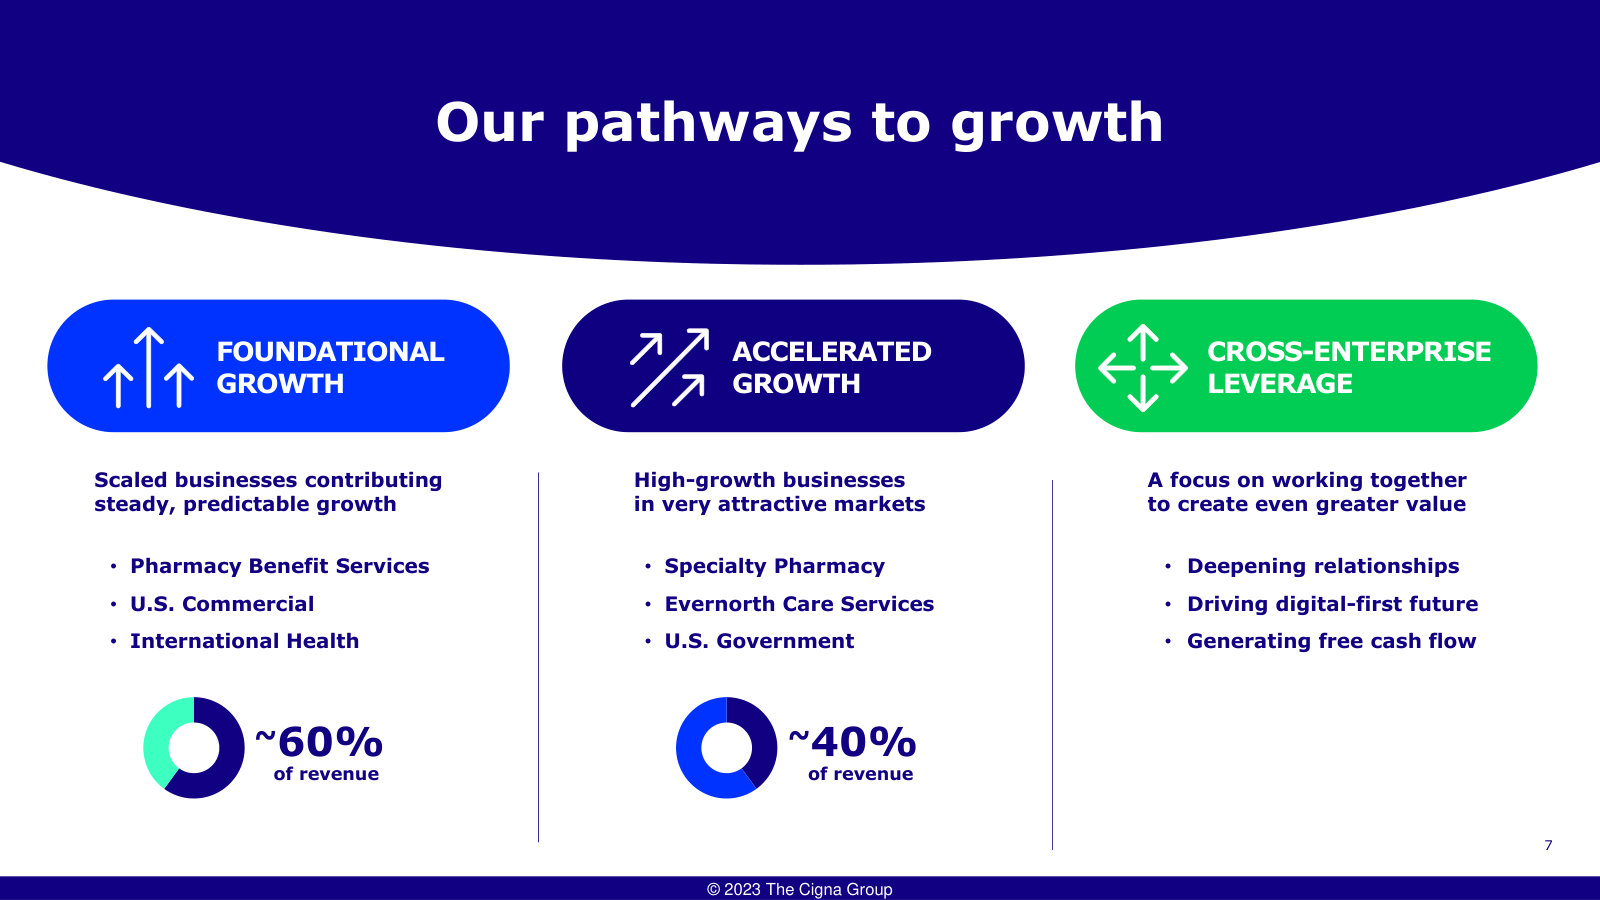
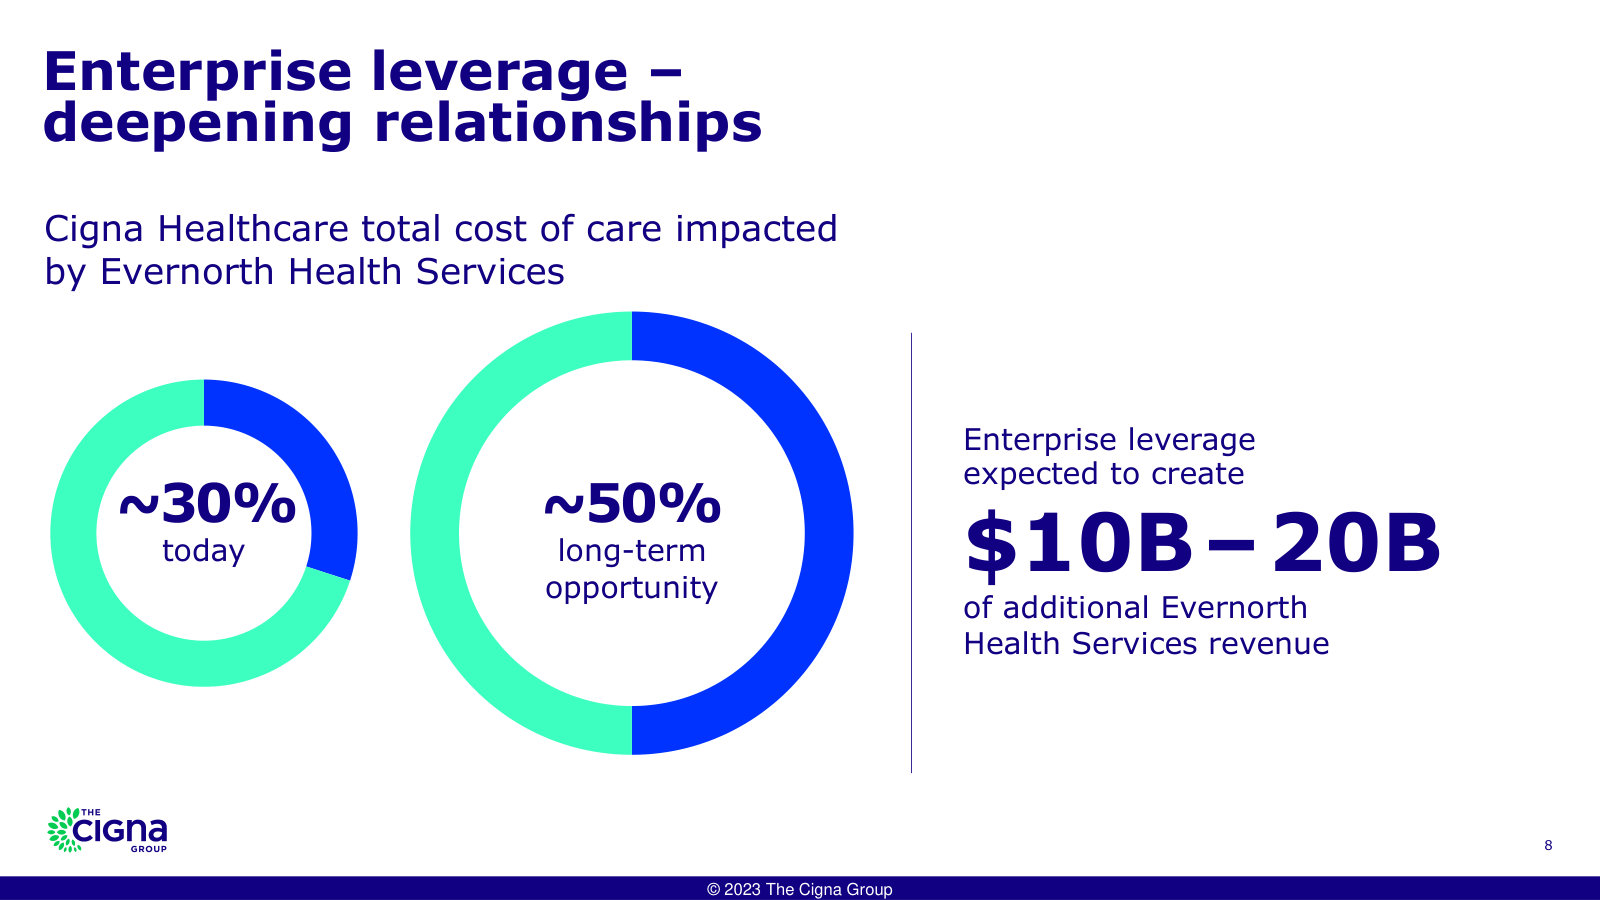
Investor Presentation — November 2023 — Q3 2023
Three slides later decks dropped: what each platform sells, how sub-businesses map to growth, and how the two sides reinforce each other. · Open the full document →
The Cigna Group's management answers for the business every quarter. These are the exchanges that explain it best — verbatim, from the call transcripts preserved in Sources. Each link opens the full transcript at that page in a new tab.
Q1 2026 Earnings Call — Q1 FY2026
David Cordani's final call: the leadership handoff, two portfolio exits, and the clearest map of where Cigna's earnings come from. · Open the full transcript →
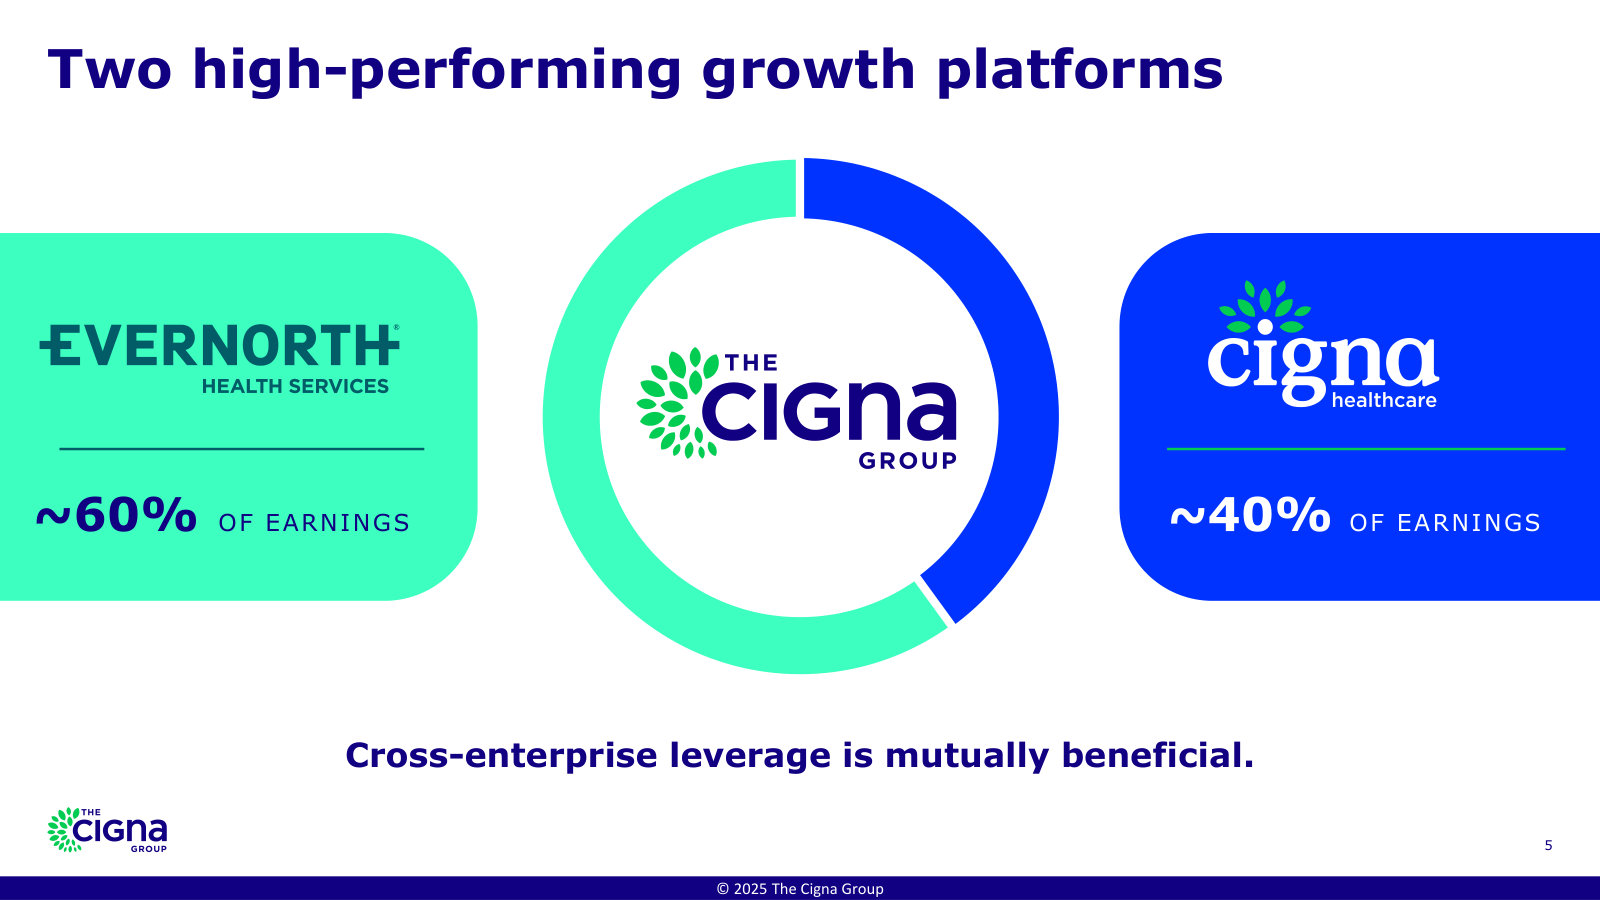
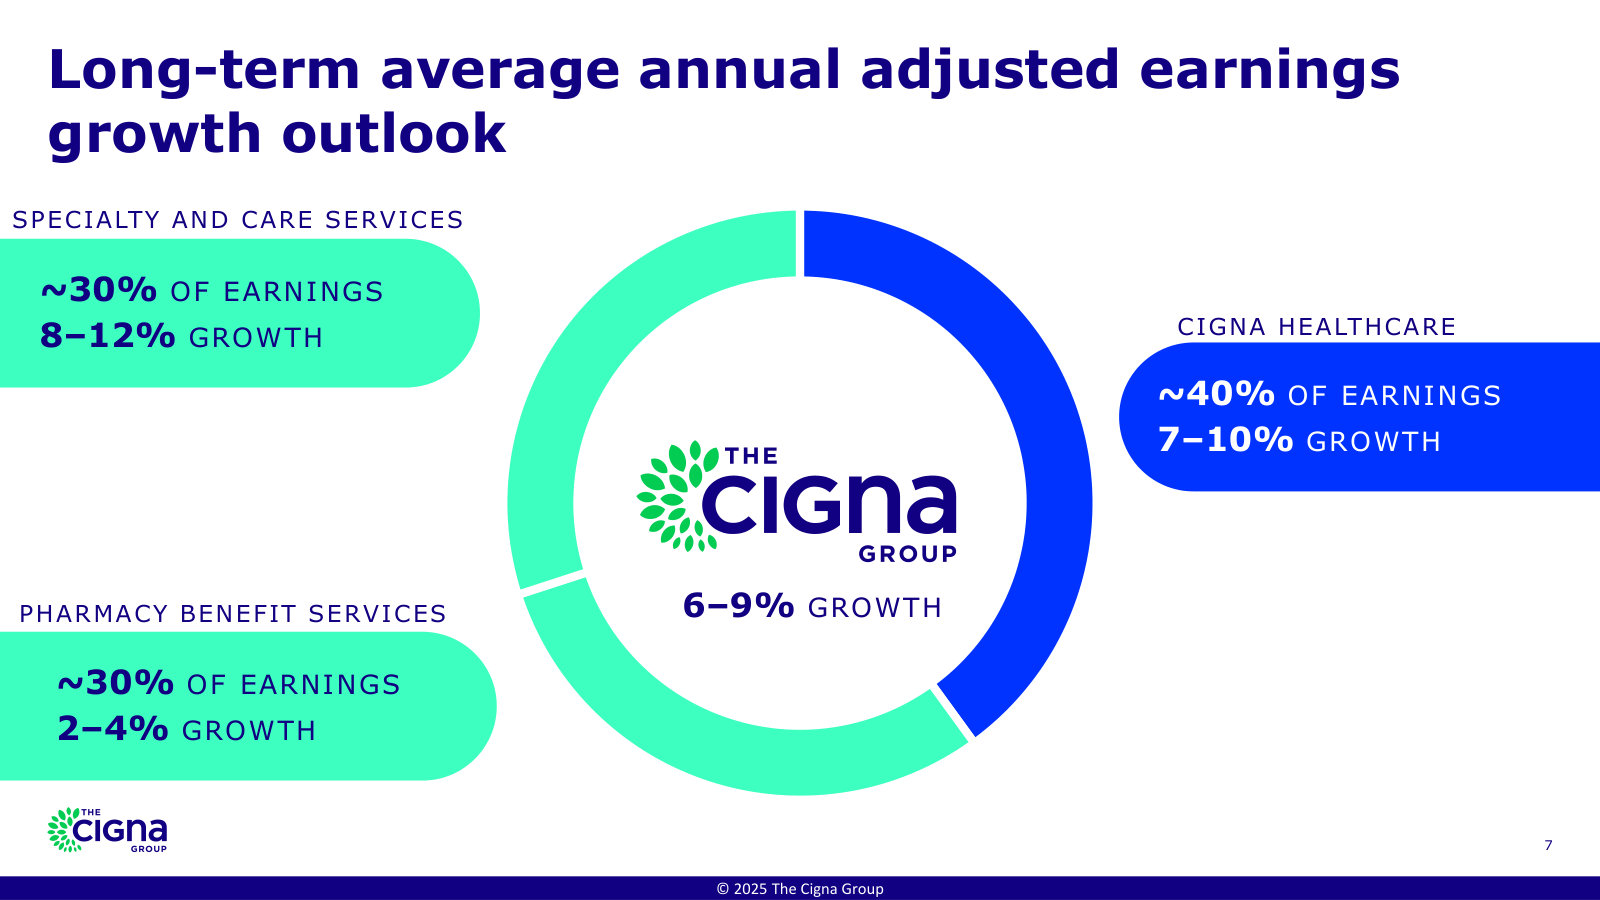
Where the earnings come from: Specialty & Care ~35%, Pharmacy Benefit Services ~25%, Cigna Healthcare ~40%.
Scott Fidel (Analyst, Goldman Sachs); Brian Evanko (President and Chief Operating Officer): One is our Specialty and Care Services platform, which now represents about 35% of the company's income and is growing 8% to 12% per year, as Ann just referenced earlier. Secondly, our Pharmacy Benefit Services platform also within Evernorth, about 25% of the company's income is going through the transformation that I was alluding to earlier, and we're confident on the long-term durability of that. And then finally, our Cigna Healthcare business, which represents the other 40% of the company's income, which is our high-performing health plan business, underpinned by our flagship U.S. employer business, which has shown a long track record of growing at above market rates.
p. 10 · Read in context →
Guidance philosophy: priced for sustained elevated cost trend; deceleration would be upside, not baseline.
Brian Evanko (President and Chief Operating Officer): As Ann said, we continue to plan for and price for sustained elevated cost trends. On the positive side, they have not accelerated. They remained elevated. So to the extent we do eventually see some deceleration, that offers some upside to our outlook.
p. 14 · Read in context →
Q4 2025 Earnings Call — Q4 FY2025
The FTC settlement resolved and PBM reform passed — management lays out how the rebate-free model actually gets paid, margin profile intact. · Open the full transcript →
The FTC global settlement, framed: $7B in out-of-pocket relief over ten years, resolving insulin litigation and investigations.
David Cordani (Chairman and Chief Executive Officer): The settlement is a comprehensive resolution of all matters brought by the FTC regarding our pharmacy benefits business. It includes the industry-wide insulin lawsuit and ongoing investigations. […] The settlement noted $7 billion in out-of-pocket cost relief over the next ten years for the 100 million customers and patients we serve. The savings will be delivered through lower insulin prices and reduced costs for brand-name medications for consumers at the pharmacy counter.
p. 2 · Read in context →
How the rebate-free model makes money: a delinked per-member/per-script admin fee plus at-risk clinical programs, same profitability.
Scott Fidel (Analyst, Goldman Sachs); Brian Evanko (President and Chief Operating Officer): the core value creators in both our legacy models and our new rebate-free model really remain the same. Think about securing better unit pricing for prescription drugs, administering benefits for plan sponsors, and supporting patients with clinical safety checks and advanced clinical programs. […] So there's two primary ways we get paid in the future in this model. The first is a core admin fee. That'll be per member or per script, delinked from the price of the drug, that'll grow with inflation over time. And then the second category would be for clinical programs and other innovations that we bring to market. And we expect to take risk on this portion of compensation. But in aggregate, as David said earlier, we expect to achieve a comparable level of profitability between the legacy model and the new model, although the sources of profit will evolve as I outlined.
p. 8 · Read in context →
The specialty growth engine: a $400B+ market, 13% script growth, an 8–12% income algorithm, $100B of biosimilar competition by 2030.
Erin Wright (Analyst, Morgan Stanley); Brian Evanko (President and Chief Operating Officer): this is already a $400 billion plus addressable market growing at a high single-digit secular growth rate, and we're really well-positioned to capitalize on that over the longer run. […] the full year we had 13% growth in prescriptions, higher rate of growth in our Medicare book of business, but also strong growth in the commercial employer and the Medicaid portfolio […] We continue to expect long term average annual income growth of 8% to 12% in this business, benefiting from some of these strong secular tailwinds. […] we expect another $100 billion of specialty drug spend to be subject to competition from biosimilars and generics by 2030.
p. 11 · Read in context →
Q3 2025 Earnings Call — Q3 FY2025
Where the rebate-free model was first unveiled: the drug-pricing problem it solves and a three-part framework for modeling the PBM through the transition. · Open the full transcript →
The problem the model targets: generics are 90% of scripts but ~10% of spend; brands are 10% of volume but 88% of spend.
David Cordani (Chairman and CEO): generic drugs now account for 90% of all prescriptions, and on average, they are one-third cheaper than in other countries. […] On the other hand, prices for brand name medications continue to skyrocket, with those drugs that do not have a generic equivalent costing four times as much as the same drug in European markets. […] even though brand name drug medications comprise only 10% of overall pharmaceutical volumes in the United States, they account for 88% of the spend.
p. 2 · Read in context →
The new model, first unveiled: upfront discounts replacing post-purchase rebates, ~30% lower brand cost, standard by 2028.
David Cordani (Chairman and CEO): we've stepped forward with our new simple and transparent model for pharmacy benefit services, which will replace the complex post-purchase rebate process with a simple upfront discount that will enable customers and patients to automatically pay the lowest price at the counter, whether through their benefit or on a cash pay basis and apply their payments to the deductible. […] for Americans and health plans where they pay the full cost of medications, our new model will reduce the cost for a brand name drug prescription on average by 30%. […] Cigna Healthcare will adopt this model 100% for fully insured lives beginning in 2027, and it will become our standard offering broadly for the Cigna Group to the marketplace starting in January 2028.
p. 2 · Read in context →
A framework for the transition: $90B of renewed large-client revenue, temporary 2026–27 investment costs, and a stable core book.
Lisa Gill (Analyst, JPMorgan); Brian Evanko (President and COO): When considering how to model this business going forward, I suggest breaking it into three categories. The first category includes the three major clients we've mentioned, accounting for roughly $90 billion in annual revenue, with the margin profile for 2026 expected to sustain through the decade. […] The second category pertains to the costs associated with transitioning to the new rebate-free model, which will create margin pressures in 2026 and 2027 but should diminish afterward. The third category reflects the fundamental earnings profile from the remainder of our pharmacy benefit services book, which we expect will remain stable in terms of client level earnings contributions, ensuring comparable contributions from our rebate-free model as from our existing solutions.
p. 7 · Read in context →
Guidance philosophy through the pivot: two platforms on-algorithm in 2026, PBS off, enterprise back on-algorithm in 2027.
David Cordani (Chairman and CEO); Justin Lake (Analyst, Wolfe Research): As you think about the building blocks of the capabilities, our CHC are on algorithm in '26, Specialty & Care on algorithm in '26, PBS off algorithm in '26. […] while there are investments that will carry into 2027, it would be reasonable to assume we expect to be back on algorithm for the enterprise level for 2027 with the strength of the franchise.
p. 8 · Read in context →
Q4 2024 Earnings Call — Q4 FY2024
The stop-loss shock, explained: a cost miss and the two-year margin-recovery plan, alongside the post-Brian-Thompson push on transparency. · Open the full transcript →
Management addresses the moment: after the killing of UnitedHealth's Brian Thompson, accelerating transparency and accountability.
David Cordani (CEO): In early December, we all witnessed the tragic murder of Brian Thompson, a leader at the UnitedHealth Group. The past several weeks have further challenged us to listen more intensely to the public narrative about our industry. At the Cigna Group, we are further accelerating improvements and innovations to increase transparency, expand support, and drive even greater accountability.
p. 1 · Read in context →
What stop-loss is and why it missed: employers cap catastrophic-claim risk; high-cost claimants and specialty drugs drove Q4 variability.
Brian Evanko (CFO): stop loss is a unique product within our portfolio where employers limit their risk from unexpected high-cost claims by transferring that risk for medical costs above a specific individual or aggregate employer dollar amount. […] This year, variability was more pronounced in the fourth quarter as we had an increase in the number of high-cost claimants related to cost pressures from the continued acceleration in the prescribing and use of specialty medications, as well as elevated high-acuity surgical activity.
p. 3 · Read in context →
Why the miss is recoverable: stop-loss is only sold integrated with first-dollar coverage; 50%+ of those clients stay 5+ years.
Stephen Baxter (Analyst, Wells Fargo); Brian Evanko (CFO): we don't write standalone stop loss coverage. So our entire book of business reflects an integrated employer offering where we're providing the firstdollar coverage alongside. […] well over 50% of our employer clients who choose our stop loss products have been clients of Cigna Healthcare for five years or more.
p. 6 · Read in context →
Q4 2023 Earnings Call — Q4 FY2023
The portfolio-shaping landmark: exiting Medicare Advantage to double down on capital-light Evernorth services, funded by the Express Scripts payoff. · Open the full transcript →
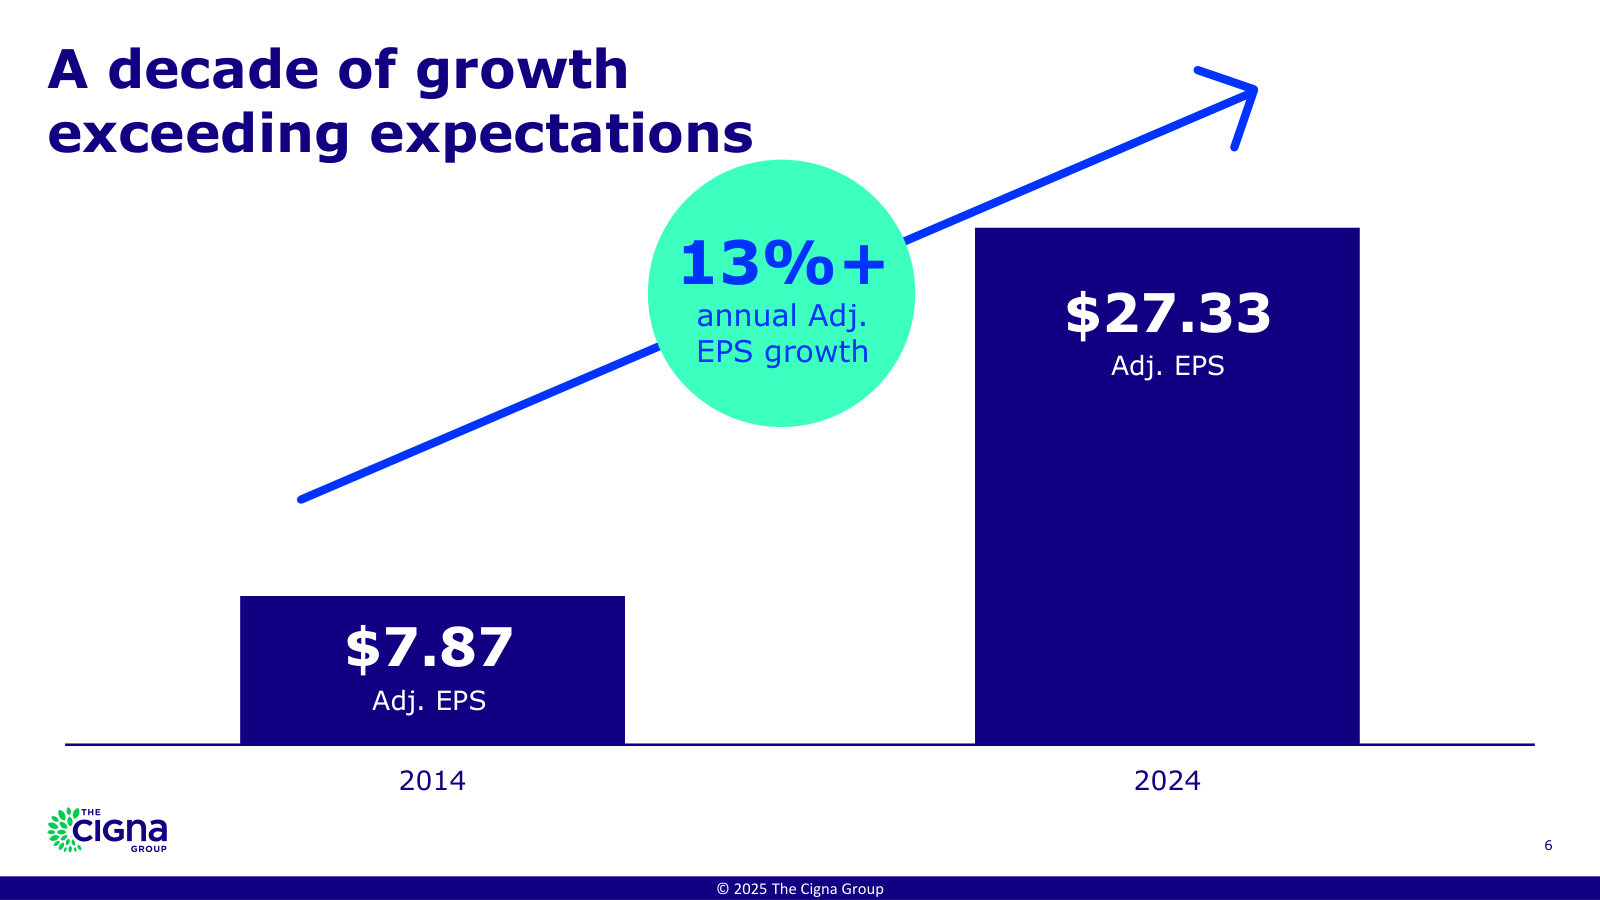
The track record: 13%+ annualized EPS growth over a decade, every Express Scripts goal met, $27B returned to shareholders.
David Cordani (Chairman and Chief Executive Officer): As a result of our focus, discipline, and sustained execution, over the past decade, we've delivered adjusted EPS growth of more than 13% on an annualized basis. In the five years since our acquisition of Express Scripts, we've achieved or surpassed every goal we established for the combined company. Through 2023, we've grown revenue by over $50 billion and met or exceeded our adjusted EPS objectives each year. And we've returned $27 billion to shareholders through share repurchase as well as attractive dividend payments.
p. 5 · Read in context →
Why exit Medicare Advantage: an attractive market, but capital-intensive and heavily regulated relative to its size in the portfolio.
A.J. Rice (Analyst, UBS); David Cordani (Chairman and Chief Executive Officer): We see it as a win-win and it's a clarification to our strategy within our portfolio. As I noted in my prepared remarks, while we view the market as a attractive growth market, the required capital investment resources focus relative to its size within our portfolio, coupled with the continued elevated regulatory environment, our decision was it was best to enter this transaction.
p. 14 · Read in context →
The strategic pivot: grow government reach through capital-light Evernorth services rather than owning the health plan.
David Cordani (Chairman and Chief Executive Officer): We will continue in a long-term service relationship with HCSC that further expands our proven track record within Evernorth. We see the Evernorth service portfolio as an attractive, capital-light, high-visibility way to grow this portfolio. And as we have in the past, we will maintain very strong discipline for capital deployment, and our 2024 capital deployment priorities are quite clear.
p. 15 · Read in context →
More calls
Q2 2025 Earnings Call — Q2 FY2025 · 14 pages · Mid-2025 read on the stop-loss margin-recovery plan and specialty momentum — the quarter before the rebate-free model was unveiled. · Open →
Q1 2025 Earnings Call — Q1 FY2025 · 15 pages · First quarter after the Medicare divestiture closed and Evanko/Dennison were named to new roles — the reset earnings base and early stop-loss recovery signals. · Open →
Q2 2024 Earnings Call — Q2 FY2024 · 14 pages · Progress on the Medicare Advantage sale to HCSC and the Evernorth specialty and care build-out at mid-2024. · Open →
Q1 2023 Earnings Call — Q1 FY2023 · 40 pages · An early call under the newly renamed Cigna Group for baseline framing of the Evernorth and Cigna Healthcare two-platform model. · Open →
Q4 2021 Earnings Call — Q4 FY2021 · 49 pages · A pandemic-era annual call for fuller strategic framing of the Evernorth build-out and the long-term growth algorithm before the recent portfolio moves. · Open →
The Cigna Group's annual reports contain management's most considered account of the business. These are the sections, passages and visual pages worth opening in the originals preserved in Sources.
The Cigna Group — FY2025 Annual Report (Form 10-K) — FY2025
The latest 10-K: a pharmacy-services-plus-health-benefits company reshaped by the 2025 exit of Medicare Advantage. · Open the full document →
Item 1. Business — p. 5 · Read the full section →
Management's own framing of the two-segment model — Evernorth pharmacy services and Cigna Healthcare benefits.
How Cigna defines its two segments and the scale behind them.
At The Cigna Group our global workforce of approximately 67,700 colleagues strives to fulfill our mission to improve the health and vitality of more than 185 million customer relationships in more than 30 markets and jurisdictions (as of December 31, 2025). […] Evernorth Health Services includes our Pharmacy Benefit Services and Specialty and Care Services operating segments, which provide independent and coordinated health solutions and capabilities to enable the health care system to work better and help people live healthier lives. […] Cigna Healthcare includes our U.S. Healthcare and International Health operating segments, which provide comprehensive medical and coordinated solutions to clients and customers.
p. 5 · Read in context →
Item 1A. Risk Factors — p. 37 · Read the full section →
The risks specific to a PBM-led health company — drug-pricing benchmarks and the new front of AI/ML use.
Item 7. Management's Discussion and Analysis — p. 72 · Read the full section →
Where management explains what actually moved 2025 results — chiefly the HCSC (Medicare Advantage) divestiture.
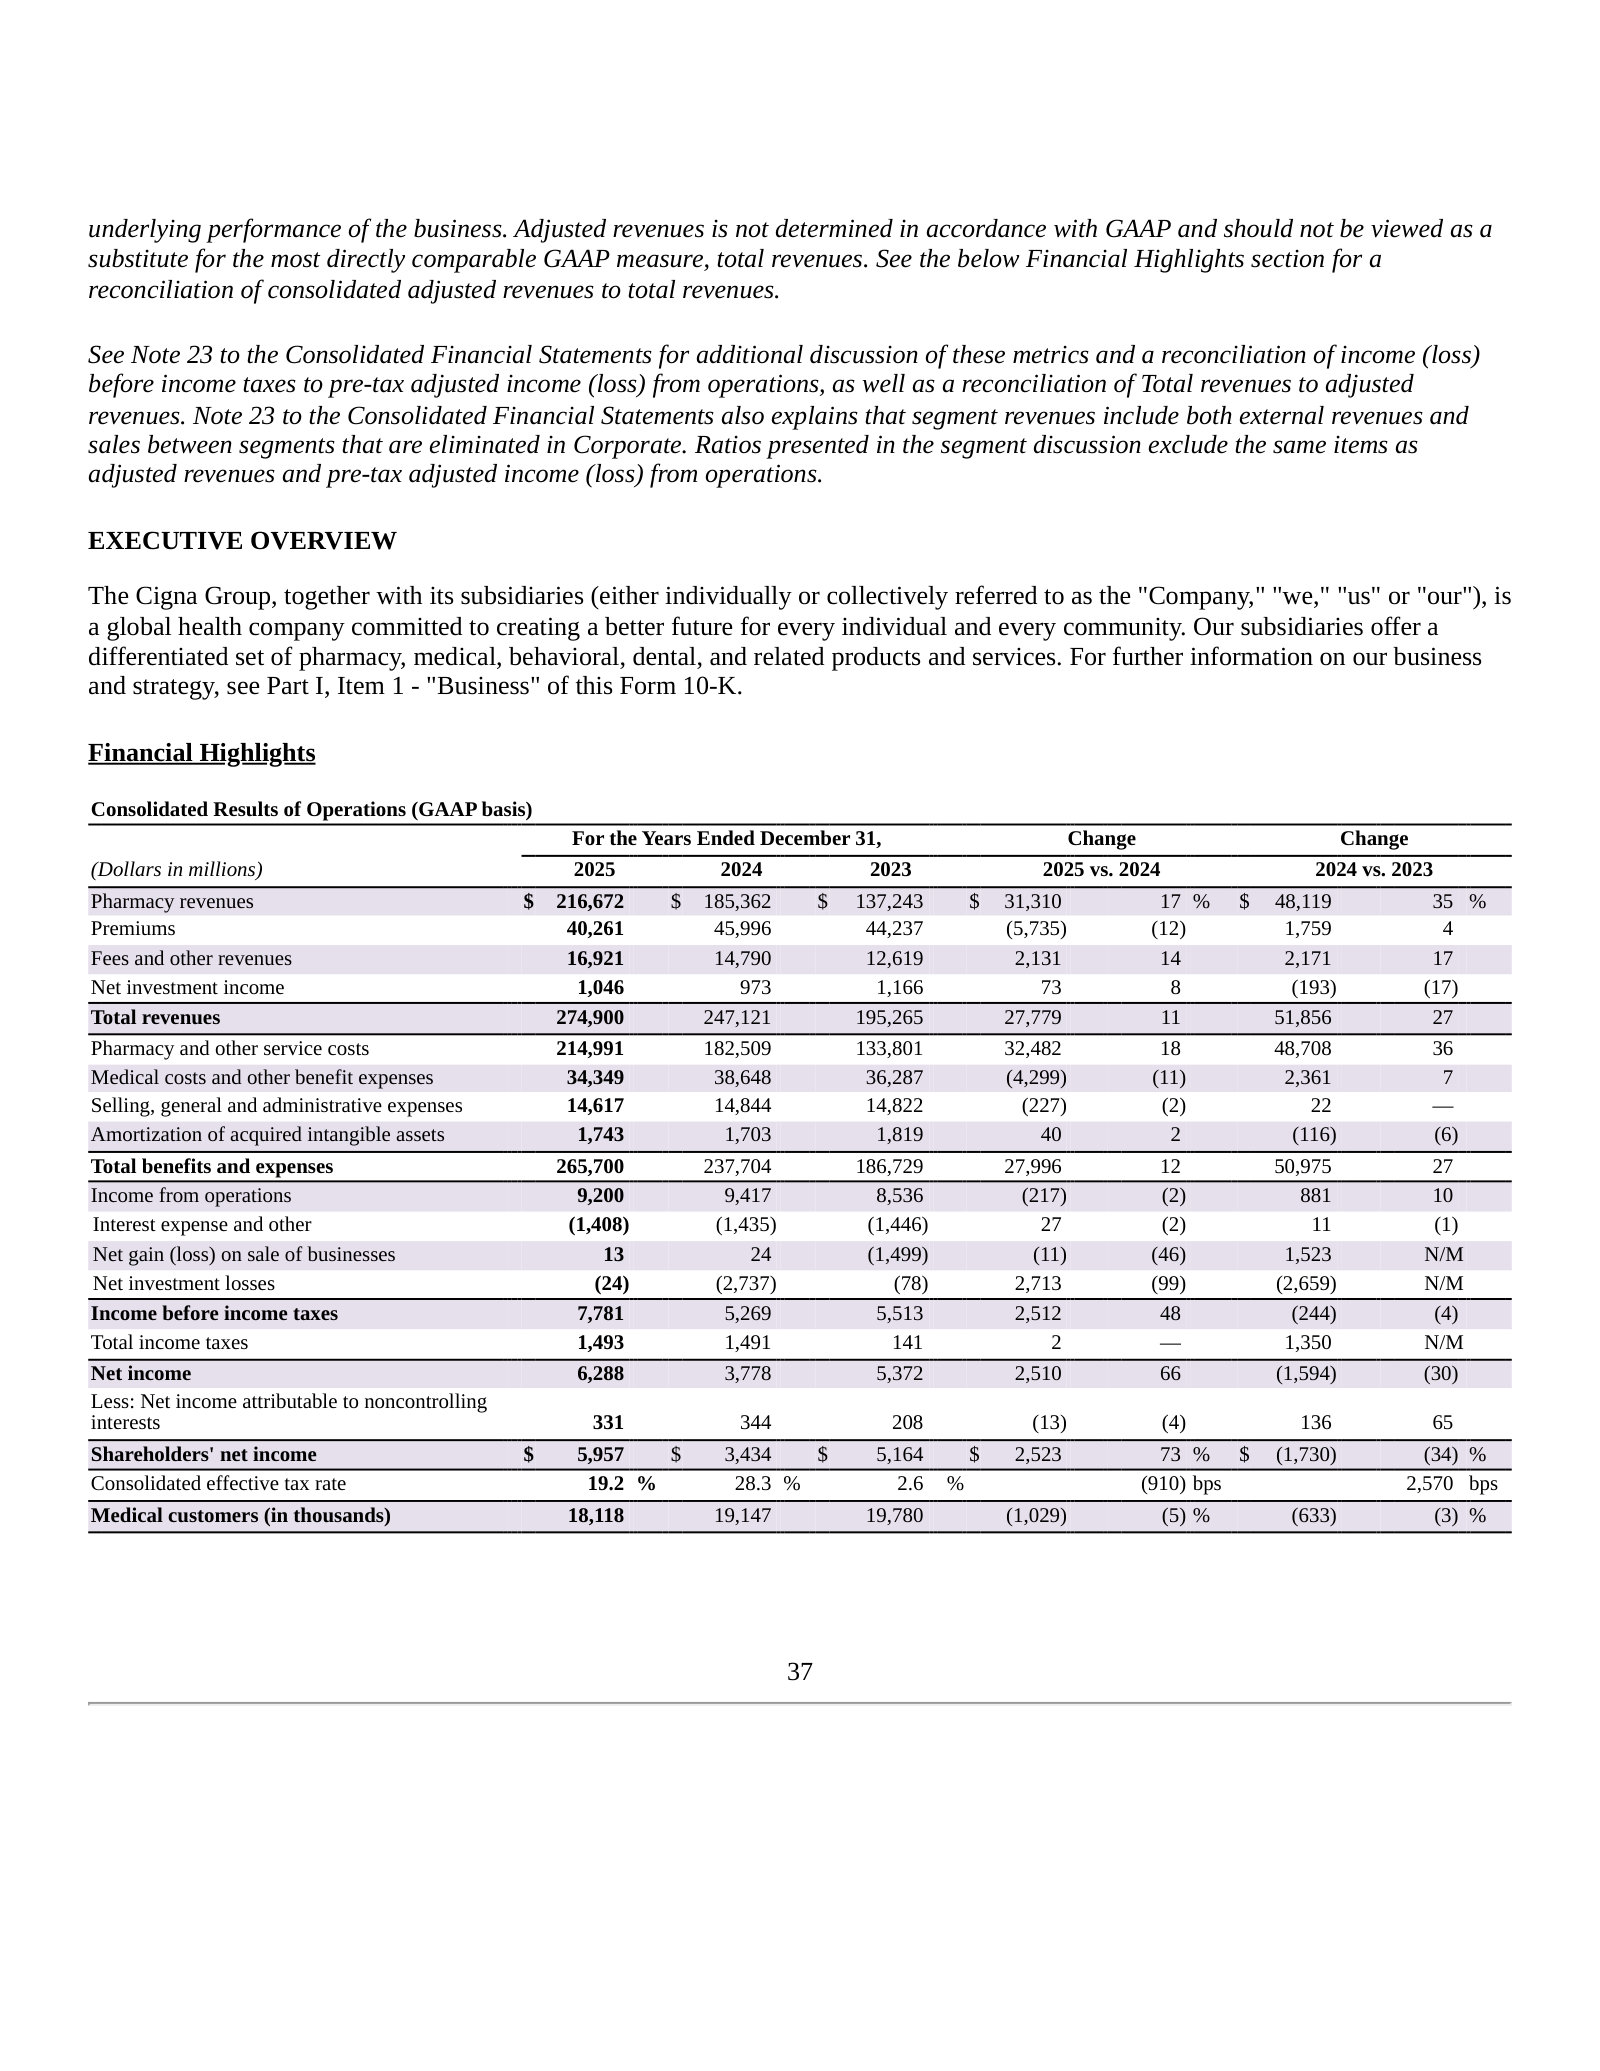
Line-by-line drivers of the 2025-versus-2024 change, in management's words.
Shareholders' net income increased 73%, primarily reflecting the absence of the impairment of VillageMD equity securities that was recorded in 2024. […] Pharmacy revenues increased 17%, primarily reflecting higher utilization of prescription drugs from customer growth in Evernorth Health Services. […] Premiums decreased 12%, primarily driven by the impact of the HCSC transaction (-18%), partially offset by higher premium rate within our ongoing U.S. Healthcare businesses (+4%). […] Medical costs and other benefit expenses decreased 11%, primarily driven by the impact of the HCSC transaction (-18%), partially offset by higher medical costs within our ongoing U.S. Healthcare businesses (+7%).
p. 77 · Read in context →
Segment Reporting — p. 77 · Read the full section →
How each segment actually earns — the utilization, claims-mix and affordability-rebate levers behind Evernorth.
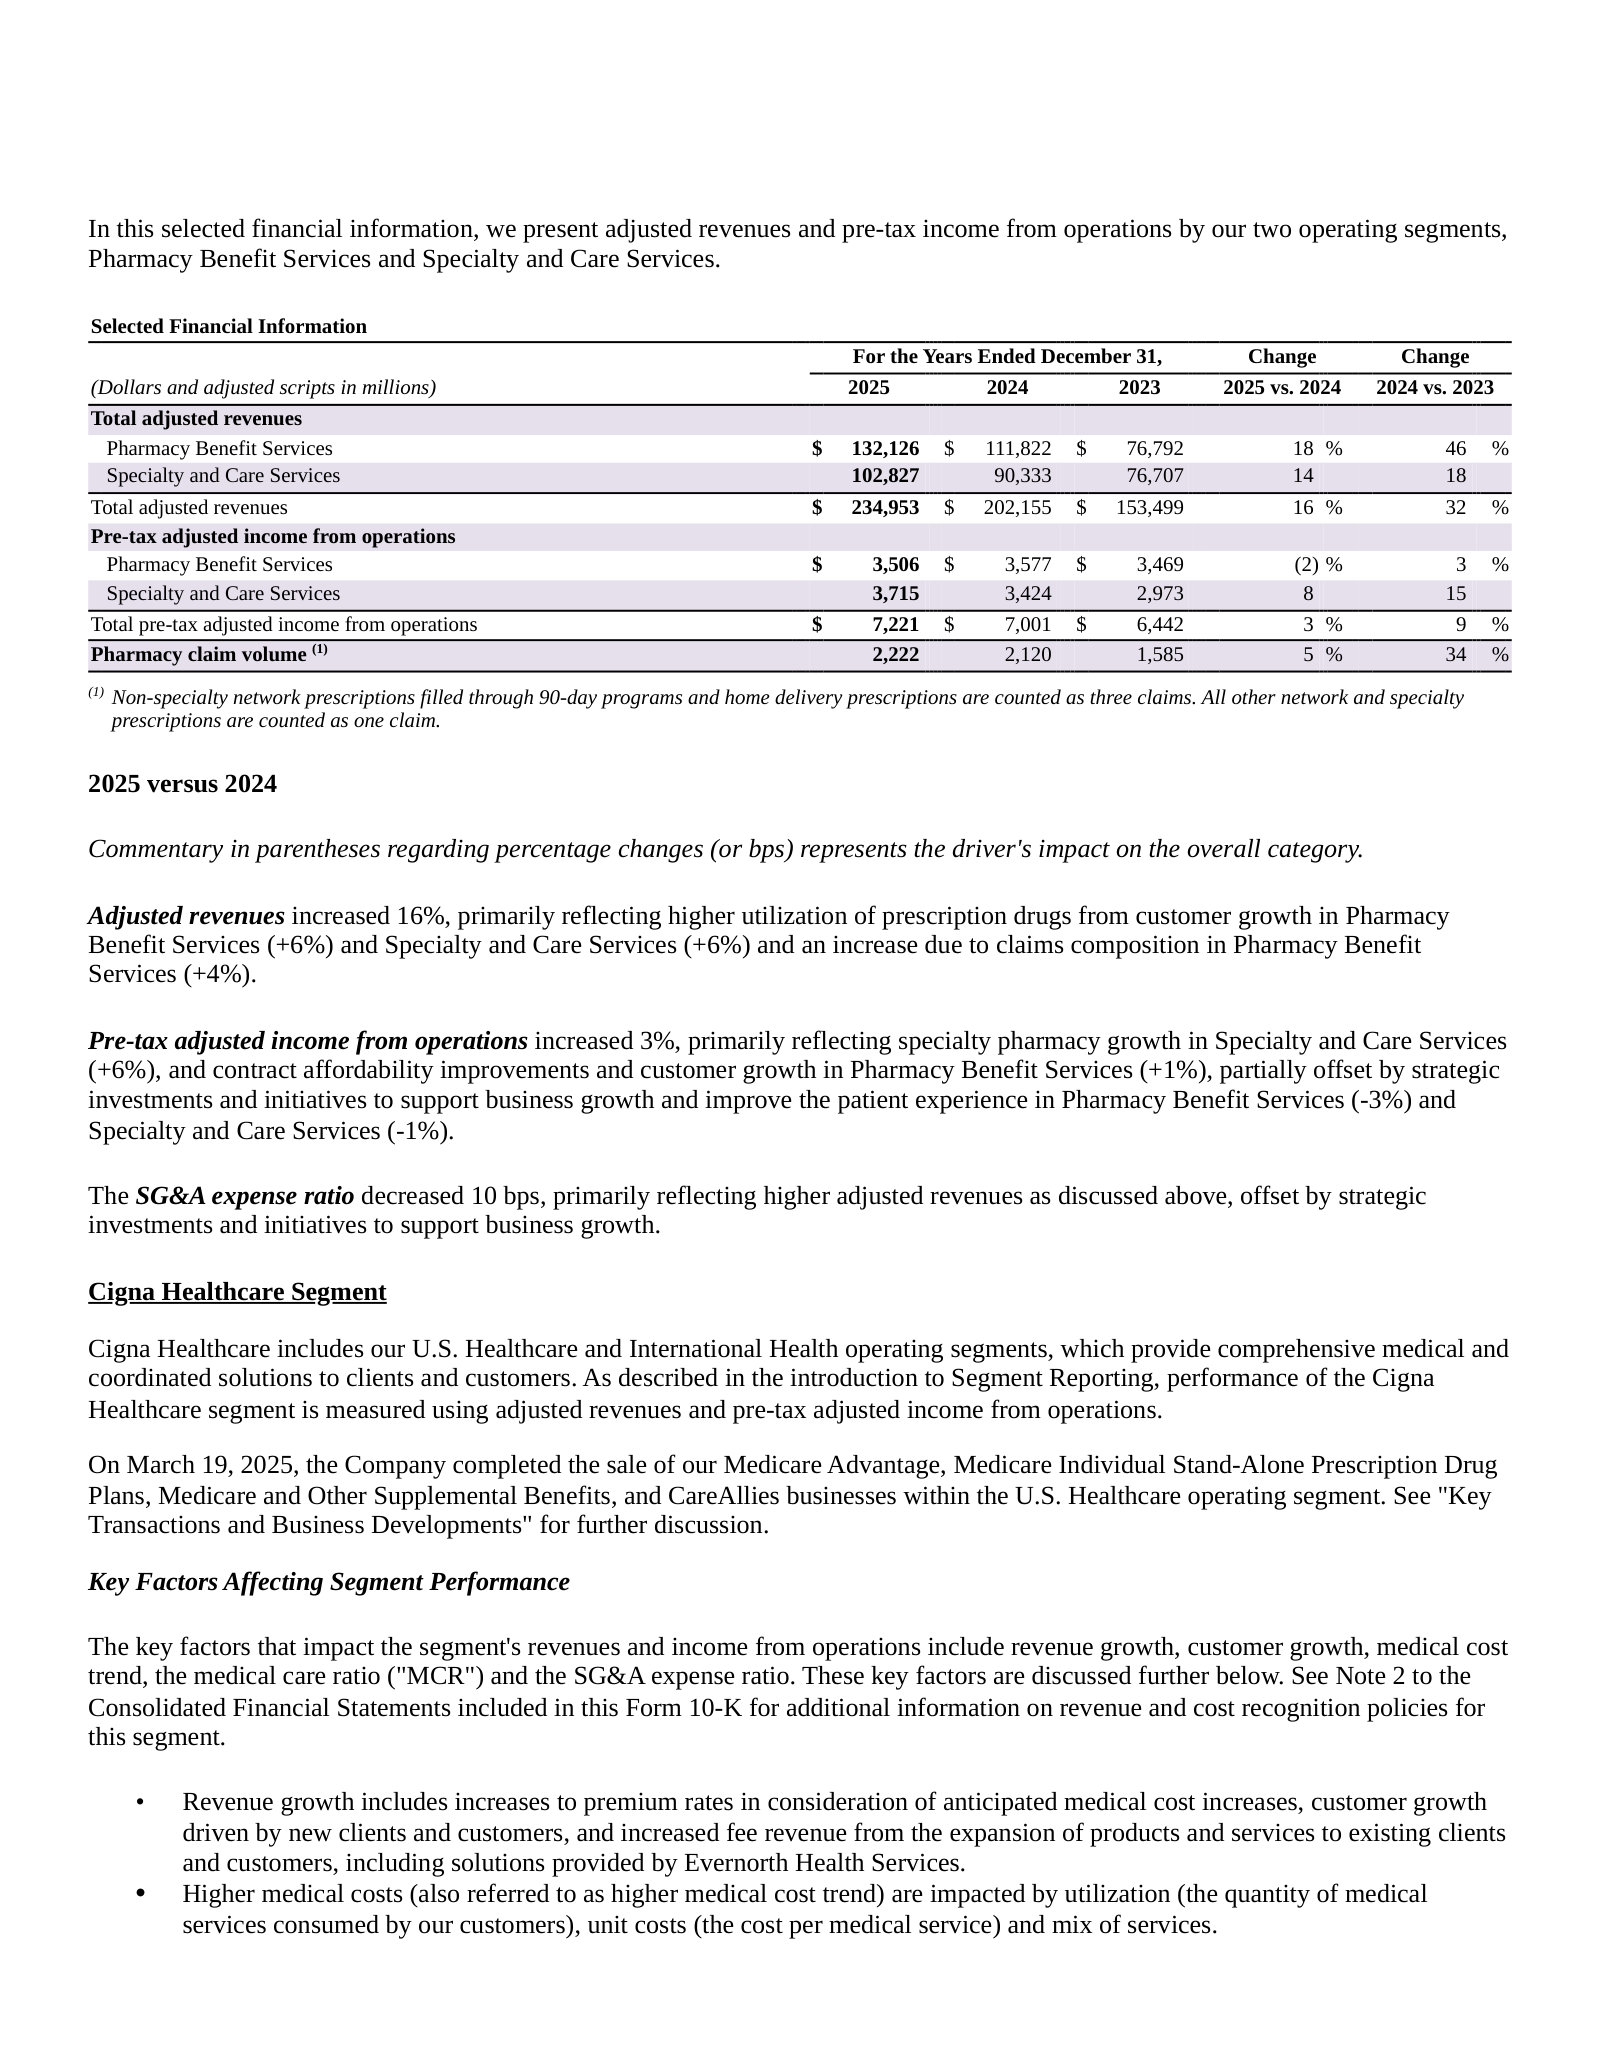
The levers that drive Evernorth revenue and income: utilization, claims mix, affordability.
The key factors that impact the segment's revenues and income from operations are claims utilization, claims composition and contract affordability services. […] Our client contract pricing is impacted by our ongoing ability to negotiate favorable contracts for pharmacy network, pharmaceutical and wholesaler purchasing, and manufacturer rebates (also referred to as affordability improvements or affordability services).
p. 79 · Read in context →
Critical Accounting Estimates — p. 90 · Read the full section →
The unpaid-claims reserve is the estimate that defines a managed-care income statement — small assumption shifts move net income.
Medical-cost reserves and the sensitivity of net income to trend and completion-factor assumptions.
Unpaid claims and claim expenses reflect estimates of the ultimate cost of claims that have been incurred but not reported, expected development on reported claims, claims that have been reported but not yet paid (reported claims in process) and other medical care expenses and services payable […] Unpaid claims and claim expenses in Cigna Healthcare are primarily impacted by assumptions related to completion factors and medical cost trend. […] A 100 basis point increase in the medical cost trend rate would increase this liability by approximately $115 million, resulting in a decrease in net income of approximately $90 million after-tax
p. 94 · Read in context →
Cigna Corporation — FY2021 Annual Report (Form 10-K) — FY2021
Featured for one section: the 2021 restructuring that created today's Evernorth / Cigna Healthcare segment map. · Open the full document →
Item 1. Business — p. 6 · Read the full section →
Captures the segment redefinition — International Markets folded in, Chubb divestiture pending — that reshaped reporting.
The 2021 segment realignment and the then-current Cigna Healthcare composition (U.S. Commercial, U.S. Government, International Health).
In connection with the pending Chubb Transaction, we revised our business reporting structure. […] we adjusted our segment reporting effective in the fourth quarter of 2021 so that the results previously reported in the International Markets segment are now reported as follows: […] Cigna Healthcare includes Cigna's U.S. Commercial, U.S. Government and International Health operating segments that provide comprehensive medical and coordinated solutions to clients and customers.
p. 8 · Read in context →
More annual reports
The Cigna Group — FY2024 Annual Report (Form 10-K) — FY2024 · 214 pages · The year before the Medicare Advantage exit; carries the VillageMD impairment that depressed 2024 net income. · Open →
The Cigna Group — FY2023 Annual Report (Form 10-K) — FY2023 · 269 pages · Baseline for the two-segment era before recent divestitures reshaped the top line. · Open →
The Cigna Group — FY2022 Annual Report (Form 10-K) — FY2022 · 257 pages · First full year under The Cigna Group name and the Evernorth / Cigna Healthcare structure. · Open →
Source: S&P Capital IQ consensus via Xpressfeed · Generated 2026-07-22.
Cigna's consensus tape pairs steady mid-single-digit revenue growth with normalized EPS that reaccelerates from under 2% in 2026 to low-double-digit gains through 2029 — a margin- and capital-return-driven earnings story. The beat record is consistent: revenue has topped consensus for eight straight quarters and normalized EPS in every quarter but a −15% Q4 2024 miss. Yet forward estimates have barely moved in six months, and the street sits bullish with no sell ratings and a $341 mean target. The main fault line is GAAP net income, where analysts disagree sharply while clustering tightly on adjusted EPS.
Forward estimates
Currency: USD · Scale: money in millions, absolute · YoY uses the prior fiscal year from the feed; analyst count and range use the first displayed period.
| Metric | FY2025A | FY2026E | FY2027E | FY2028E | FY2029E | YoY | Analysts | Low / high |
|---|---|---|---|---|---|---|---|---|
| Revenue | $269.86bn | $284.46bn | $296.83bn | $313.11bn | $322.06bn | — | 11 | $253.30bn / $277.15bn |
| EBITDA | $12.89bn | $13.34bn | $14.48bn | $15.21bn | $15.35bn | — | 14 | $11.33bn / $14.83bn |
| EPS (normalized) | $29.65 | $30.41 | $33.48 | $37.01 | $41.92 | — | 24 | $29.60 / $29.78 |
Beat / miss record
Current sequences by metric: Revenue: 8 consecutive beats; EPS (normalized): 5 consecutive beats.
Currency: USD · Scale: money in millions, absolute · Consensus is captured before each actual first became effective.
| Quarter | Metric | Consensus | Actual | Surprise | Outcome |
|---|---|---|---|---|---|
| Q1 FY2026 | Revenue | $66.20bn | $68.49bn | +3.5% | Beat |
| Q1 FY2026 | EPS (normalized) | $7.61 | $7.79 | +2.4% | Beat |
| Q4 FY2025 | Revenue | $69.08bn | $72.47bn | +4.9% | Beat |
| Q4 FY2025 | EPS (normalized) | $7.88 | $8.08 | +2.5% | Beat |
| Q3 FY2025 | Revenue | $66.74bn | $69.75bn | +4.5% | Beat |
| Q3 FY2025 | EPS (normalized) | $7.64 | $7.83 | +2.5% | Beat |
| Q2 FY2025 | Revenue | $62.51bn | $67.18bn | +7.5% | Beat |
| Q2 FY2025 | EPS (normalized) | $7.15 | $7.20 | +0.6% | Beat |
| Q1 FY2025 | Revenue | $60.53bn | $65.50bn | +8.2% | Beat |
| Q1 FY2025 | EPS (normalized) | $6.35 | $6.74 | +6.2% | Beat |
| Q4 FY2024 | Revenue | $63.18bn | $65.68bn | +4.0% | Beat |
| Q4 FY2024 | EPS (normalized) | $7.82 | $6.64 | -15.1% | Miss |
| Q3 FY2024 | Revenue | $59.59bn | $63.70bn | +6.9% | Beat |
| Q3 FY2024 | EPS (normalized) | $7.25 | $7.51 | +3.5% | Beat |
| Q2 FY2024 | Revenue | $58.32bn | $60.47bn | +3.7% | Beat |
| Q2 FY2024 | EPS (normalized) | $6.42 | $6.72 | +4.7% | Beat |
Forward estimates barely moved in six months — no line shifted more than ~1.3%
The largest six-month revision is FY2028 revenue, up about 1.3%; FY2027 revenue is down about 1%, and normalized EPS for both years is essentially flat. Consensus has not chased the recent beats into higher out-year numbers.
Currency: USD · Scale: money in millions, absolute · Point-in-time consensus; Δ90d is Now versus 90d.
| Metric | FY | 180d | 90d | 30d | Now | Δ90d |
|---|---|---|---|---|---|---|
| Revenue | FY2027 | $299.78bn | $297.38bn | $297.07bn | $296.83bn | -0.2% |
| Revenue | FY2028 | $309.01bn | $312.95bn | $312.31bn | $313.11bn | +0.1% |
| EPS (normalized) | FY2027 | $33.51 | $33.42 | $33.45 | $33.48 | +0.2% |
| EPS (normalized) | FY2028 | $37.00 | $37.14 | $36.89 | $37.01 | -0.4% |
Analysts split widely on GAAP net income even as normalized EPS stays tightly clustered
GAAP net income estimates diverge sharply — FY2027 spans roughly $6.5–10.3bn (13 analysts) and FY2028 $5.7–9.8bn (9) — reflecting uncertainty over below-the-line charges. EBITDA disagreement is also material in FY2028. Normalized EPS, by contrast, is tightly clustered.
Currency: USD · Scale: money in millions, absolute · Spread/mean is absolute high-low divided by absolute mean.
| Metric | Period | Mean | Low–high | Spread/mean | Analysts |
|---|---|---|---|---|---|
| Net income (GAAP) | FY2027E | $7.70bn | $6.46bn–$10.35bn | 50.5% | 13 |
| Net income (GAAP) | FY2028E | $7.82bn | $5.66bn–$9.82bn | 53.2% | 9 |
| EBITDA | FY2028E | $15.21bn | $12.88bn–$18.51bn | 37.0% | 11 |
Street snapshot
Currency: USD · Scale: money in millions, absolute · Analyst counts shown explicitly.
| Street view | Reading | Analysts |
|---|---|---|
| Recommendation mix | Buy 15, Outperform 5, Hold 4, Underperform 0, Sell 0 | 24 |
| Consensus score | 1.54 | 24 |
| Target price | mean $340.9; median $340.0; high $400.0; low $290.0 | 24 |
FY2029 rests on a handful of analysts
FY2029 consensus is built on very thin coverage — 2 analysts for revenue, EBITDA and GAAP net income, 4 for normalized EPS and 3 for GAAP EPS. The +13% FY2029 EPS growth and outer-year levels should be read as directional, not firm consensus.
Visible Alpha broker models via S&P Xpressfeed · 18 brokers · 478 line items · freshest revision 2026-07-09.
Cigna's modeled story is two businesses moving in opposite directions. Evernorth, the Express Scripts pharmacy-services engine, supplies the large majority of revenue and nearly all the growth, while Cigna Healthcare's top line runs roughly flat and its value rests on a bending medical-care ratio. The most differentiated signal in the broker models sits inside Evernorth, where pre-tax profit is rotating from legacy pharmacy benefits toward specialty and care services. Coverage is deep on the consolidated P&L and segment margins but thin and stale on international and group-disability lines.
Evernorth carries the top line; Cigna Healthcare revenue runs roughly flat
Evernorth's revenue rises every modeled year, whereas Cigna Healthcare's is roughly flat to slightly lower through FY-2027 before recovering. Consolidated growth is almost entirely Evernorth.
| Line | FY-2025A | FY-2026E | FY-2027E | FY-2028E | YoY | Brokers |
|---|---|---|---|---|---|---|
| Total revenue | $272.09bn | $286.09bn | $298.60bn | $316.63bn | +5.1% | 17 |
| Total revenue - Evernorth | $231.97bn | $246.78bn | $259.83bn | $273.99bn | +6.4% | 13 |
| Total revenue - Cigna Healthcare | $47.00bn | $46.06bn | $46.05bn | $49.15bn | -2.0% | 14 |
Inside Evernorth, pre-tax profit is rotating from legacy pharmacy benefits to specialty and care
Pharmacy-benefit-services pre-tax profit steps down in FY-2026 and stays below its FY-2025 level, while specialty and care services grows steadily to become the larger pre-tax contributor. Revenue growth in both is priced as much as volume-driven.
| Line | FY-2025A | FY-2026E | FY-2027E | FY-2028E | YoY | Brokers |
|---|---|---|---|---|---|---|
| Revenue | — | — | — | — | — | — |
| Revenue - Pharmacy benefit services - Operating | $130.17bn | $138.85bn | $144.81bn | $151.81bn | +6.7% | 9 |
| Revenue - Specialty and care services - Operating | $102.34bn | $109.35bn | $117.45bn | $125.85bn | +6.9% | 9 |
| Pre-tax profit | — | — | — | — | — | — |
| Income/(loss) before income tax - Pharmacy benefit services - Operating | $3.49bn | $2.74bn | $2.77bn | $2.87bn | -21.4% | 8 |
| Income/(loss) before income tax - Specialty and care services - Operating | $3.68bn | $4.15bn | $4.47bn | $4.85bn | +12.6% | 8 |
Cigna Healthcare's medical-care ratio peaks in FY-2026, then bends lower
The medical-care ratio is modeled to peak in FY-2026 before improving into FY-2028, lifting operating income even as segment revenue stays flat. This margin path, not membership, is the segment's value driver.
| Line | FY-2025A | FY-2026E | FY-2027E | FY-2028E | YoY | Brokers |
|---|---|---|---|---|---|---|
| Medical care ratio - Cigna Healthcare(%) | 84.2% | 84.2% | 83.8% | 83.6% | +0.0pt | 16 |
| Selling, general & admin. expenses ratio - Cigna Healthcare(%) | 20.1% | 20.1% | 20.0% | 20.0% | -0.0pt | 16 |
| Income from operations - Cigna Healthcare - Operating | $4.21bn | $4.53bn | $4.92bn | $5.26bn | +7.6% | 10 |
Membership growth is fee-based services, not risk
Total medical customers grow modestly, but the gain is in services-only (fee-based) lives; employer-insured (risk) membership is flat to lower. The model reads Cigna Healthcare growth as low-risk and fee-based.
| Line | FY-2025A | FY-2026E | FY-2027E | FY-2028E | YoY | Brokers |
|---|---|---|---|---|---|---|
| Total customers - Medical customers(K#) | 18.08m Number | 18.27m Number | 18.23m Number | 18.50m Number | +1.1% | 16 |
| Total customers - Services only(K#) | 13.81m Number | 14.07m Number | 14.29m Number | 14.50m Number | +1.9% | 17 |
| Total customers - Employer insured(K#) | 2.18m Number | 2.11m Number | 2.11m Number | 2.12m Number | -3.0% | 17 |
Where brokers disagree: medical-cost trend and PBM profit
Dispersion is widest on the FY-2027 medical-care ratio and Evernorth earnings, a medical-cost-trend and PBM-margin debate; headline EPS consensus (see CapIQ tab) is comparatively tight.
| Line | Period | Median | Q1–Q3 | Min–max | Brokers |
|---|---|---|---|---|---|
| Medical care ratio - Cigna Healthcare(%) | FY-2027E | 83.8% | 83.7%–84.2% | 82.7%–84.6% | 16 |
| Income from operations - Evernorth - Operating | FY-2027E | $7.91bn | $7.40bn–$8.25bn | $6.94bn–$8.89bn | 16 |
| Income/(loss) before income tax - Pharmacy benefit services - Operating | FY-2027E | $2.79bn | $2.71bn–$2.86bn | $2.51bn–$2.92bn | 8 |
| Total revenue - Cigna Healthcare | FY-2028E | $48.58bn | $48.04bn–$49.76bn | $45.96bn–$55.47bn | 12 |
Thin, stale coverage on international, group-disability and Medicare lines
Total revenue, EPS and segment margins carry up to 18 brokers with mid-2026 revisions, but International markets, Group disability & other and Medicare-advantage membership rest on a single broker with 2024-dated estimates. Treat those as one analyst's stale view, not consensus.
Headline P&L consensus, momentum and beat/miss live in the CapIQ tab.
Source: S&P Capital IQ transcripts via Xpressfeed · latest indexed call 2026-04-30 · generated 2026-07-22.
Latest call digest
The Cigna Group, Q1 2026 Earnings Call, Apr 30, 2026 · 2026-04-30T12:30:00
Q1 2026 (reported April 30, 2026) was David Cordani's final quarterly call as CEO before Brian Evanko succeeds him on July 1, with Cordani moving to Executive Chair. Prepared remarks led with strength and a raised outlook: total revenue of $68.5 billion, adjusted EPS of $7.79, and a full-year 2026 adjusted EPS guide lifted to at least $30.35. Management paired the beat with two new portfolio-shaping actions — a planned exit of the individual exchange business at the end of 2026 and a strategic review of eviCore — alongside continued progress on the rebate-free "Signature" pharmacy model and 20% adjusted-earnings growth in Specialty and Care Services.
The Q&A was less about the beat and more about the reshaping. Analysts pressed on how and when clients adopt Signature, the economics of the exchange exit and eviCore review, the drivers of specialty strength (biosimilars, Shields), and a sharp jump in the noncontrolling-interest line. Management framed both divestiture actions as proactive with no transaction to discuss, and reiterated that cost trends remain elevated but have not accelerated. Guidance actually stated: full-year adjusted EPS of at least $30.35, Evernorth adjusted income of at least $6.9 billion, Cigna Healthcare pretax adjusted earnings of at least $4.525 billion, and an unchanged full-year medical care ratio range of 83.7% to 84.7%.
Participant coverage from the latest call.
| Group | Participants | Count |
|---|---|---|
| Management | Operator; Ralph Giacobbe — Senior Vice President of Investor Relations, The Cigna Group; David Cordani — Executive Chairman of the Board, The Cigna Group; Brian Evanko — President, CEO & Director, The Cigna Group; Ann Dennison — Executive VP & CFO, The Cigna Group | 5 |
| Analysts | Albert Rice — Health Care Services Analyst, UBS Investment Bank, Research Division; Kevin Fischbeck — Managing Director in Equity Research, BofA Securities, Research Division; Lisa Gill — MD, Head of U.S. Healthcare Technology & Distribution Equity Research and Senior Research Analyst, JPMorgan Chase & Co, Research Division; Scott Fidel — Research Analyst, Goldman Sachs Group, Inc., Research Division; Charles Rhyee — MD & Senior Research Analyst, TD Cowen, Research Division; George Hill — MD & Equity Research Analyst, Deutsche Bank AG, Research Division; Justin Lake — MD & Senior Healthcare Services Analyst, Wolfe Research, LLC; Erin Wilson Wright — Equity Analyst, Morgan Stanley, Research Division; Jason Cassorla — VP & Equity Research Analyst, Guggenheim Securities, LLC, Research Division; David Windley — MD & Equity Analyst, Jefferies LLC, Research Division | 10 |
Curated latest-call exchanges; one row per analyst topic.
| Analyst | Firm | Topic | What changed in Q&A |
|---|---|---|---|
| Albert (A.J.) Rice | UBS | Signature PBM adoption and selling season | Pressed on transition mechanics, client lead times, and how much of the strong 2027 selling season is Signature versus the general market. Management said 2027 is largely the existing models, expects mid-90s retention, and Signature becomes the standard in 2028. |
| Kevin Fischbeck | BofA Securities | Exchange exit and eviCore economics | Asked about capital recaptured from the exchange exit and whether the eviCore review was inbound or strategic, and its accretion. Management called both proactive, said freed capital is not particularly material, and that there is no eviCore transaction to discuss. |
| Lisa Gill | JPMorgan | PBS cost cadence and specialty drivers | Sought the cadence of the roughly $150 million year-over-year PBS earnings step-down and the drivers of specialty strength. Management pointed to large-client renewals plus Signature investment weighted to the back half, and to volumes, biosimilars, and the Shields contribution. |
| Justin Lake | Wolfe Research | Noncontrolling-interest line jump | Dug into the $226 million NCI that more than doubled year-over-year. Management attributed it to a new joint venture with a large client where most economics pass through despite majority ownership, and said it was fully contemplated in guidance. |
| Jason Cassorla | Guggenheim Securities | Medical care ratio bridge | Questioned whether the 79.8% first-quarter MCR beat was fully explained by flu, weather, and exchange seasonality, and asked to bridge the second-quarter step-up. Management cited balanced favorability with no single outsized driver and left full-year MCR guidance unchanged. |
| Scott Fidel | Goldman Sachs | Growth-pillar continuity under new CEO | Asked how Evanko would treat the long-standing growth strategy. He reaffirmed the three core platforms and signaled intensification on data and AI, lower-cost care, and moving further upstream, with no change to the capital-deployment framework. |
| David Windley | Jefferies | GLP-1 program uptake | Asked about uptake across the GLP-1 programs. Management said weight-management coverage is roughly stable year-over-year, EnCircle enrollment continues to grow, and the demand-versus-affordability tension persists pending oral versions and easing supply. |
Theme tracker
Themes are curator-classified across supplied calls.
| Theme | Status | Quarters mentioned | Read-through |
|---|---|---|---|
| Specialty and Care Services / biosimilars | persisted | Q2 2024, Q3 2024, Q4 2024, Q1 2025, Q2 2025, Q3 2025, Q4 2025, Q1 2026 | The consistent growth engine across the window: specialty pharmacy plus biosimilars (HUMIRA, then STELARA at $0 patient out-of-pocket) and the CarepathRx and Shields additions. Specialty and Care Services grew 20% in Q1 2026 and is framed as about 35% of company income. |
| Rebate-free "Signature" pharmacy model | emerged | Q3 2025, Q4 2025, Q1 2026 | Announced on the Q3 2025 call and dominant since. It becomes the standard model in 2028, with a target of at least 50% of Evernorth Pharmacy Benefit Services members by year-end 2028, reframing the PBM story from transparency commitments to a full rebate-free redesign. |
| Elevated medical cost trend | persisted | Q4 2024, Q1 2025, Q2 2025, Q3 2025, Q4 2025, Q1 2026 | A standing planning assumption throughout. The language migrated from "broadly in line" in 2024 to "persistently elevated" across 2025; by Q1 2026 management adds that trend has not accelerated, offering potential upside if it decelerates. |
| Stop-loss margin pressure and recovery | persisted | Q4 2024, Q1 2025, Q2 2025, Q3 2025 | Stop-loss drove the Q4 2024 earnings miss and recurred through 2025 as management repriced. A roughly 100 basis point, two-year margin recapture (majority in 2026, remainder 2027) was laid out, and the topic receded from prominence by Q1 2026. |
| Medicare Advantage divestiture | dropped | Q4 2023, Q1 2024, Q2 2024, Q3 2024, Q4 2024, Q1 2025 | The sale of the Medicare businesses to HCSC dominated calls from late 2023 through the early-2025 close, then dropped out of the narrative once completed — a clean case of a theme running its course and disappearing after execution. |
| GLP-1 coverage and clinical programs | persisted | Q2 2024, Q3 2024, Q4 2024, Q1 2025, Q2 2025, Q3 2025, Q1 2026 | GLP-1s (EnCircle, EnReach, EnGuide) recur every year, consistently framed as a tension between employee demand and employer affordability, with oral versions and easing supply cited as the route to lower net cost. |
| Portfolio shaping and business exits | persisted | Q4 2023, Q3 2024, Q3 2025, Q4 2025, Q1 2026 | A recurring management discipline: group life and disability, then Medicare, and in Q1 2026 the planned individual-exchange exit plus a strategic review of eviCore — each framed as sharpening focus on core growth platforms. |
Guidance ledger
Quotes, calls, and speakers are source-verified; outcomes are curator-classified.
| Verbatim guidance | Call | Speaker | Curator outcome | Outcome note |
|---|---|---|---|---|
| “With the strong first half performance, we continue to have confidence in our full year 2024 adjusted earnings per share outlook of at least $28.40, which represents more than 13% year-over-year growth in EPS.” | The Cigna Group, Q2 2024 Earnings Call, Aug 01, 2024 · 2024-08-01T12:30:00 | Brian Evanko | missed | Full-year 2024 adjusted EPS was reported at $27.33 on the Q4 2024 call, below the reaffirmed at-least-$28.40 outlook; management attributed the shortfall to stop-loss. |
| “And we expect full year 2025 consolidated adjusted income from operations to be at least $7.9 billion or at least $29.50 per share.” | The Cigna Group, Q4 2024 Earnings Call, Jan 30, 2025 · 2025-01-30T13:30:00 | Brian Evanko | kept | The Q4 2025 call reported full-year 2025 adjusted EPS of $29.84, above the initial at-least-$29.50 outlook. |
| “we expect to recapture approximately 100 basis points of margin in the overall Cigna Healthcare segment over the next 2 years with the majority in 2026 and the remaining in 2027.” | The Cigna Group, Q4 2024 Earnings Call, Jan 30, 2025 · 2025-01-30T13:30:00 | Brian Evanko | pending | The stop-loss recovery was scoped across 2026 and 2027; the supplied call history does not extend far enough to confirm completion. |
| “With the first quarter results, we are raising our full year 2025 adjusted earnings per share outlook to at least $29.60.” | The Cigna Group, Q1 2025 Earnings Call, May 02, 2025 · 2025-05-02T12:30:00 | Ann Dennison | kept | Full-year 2025 adjusted EPS was reported at $29.84 on the Q4 2025 call, above the raised at-least-$29.60 outlook. |
| “Our performance through the first 3 quarters gives us the confidence to deliver on our full year 2025 adjusted earnings per share outlook of at least $29.60.” | The Cigna Group, Q3 2025 Earnings Call, Oct 30, 2025 · 2025-10-30T12:30:00 | Ann Dennison | kept | Reaffirmed at least $29.60 for 2025; the Q4 2025 call reported $29.84. |
| “We are confident in our ability to deliver full year 2026 adjusted earnings of at least $30.25 per share and our ability to deliver attractive long-term EPS growth.” | The Cigna Group, Q4 2025 Earnings Call, Feb 05, 2026 · 2026-02-05T13:30:00 | Ann Dennison | pending | 2026 is in progress; on the Q1 2026 call the outlook was raised to at least $30.35, tracking above this initial floor. |
| “With the first quarter results, we are raising our full year 2026 adjusted earnings per share outlook to at least $30.35.” | The Cigna Group, Q1 2026 Earnings Call, Apr 30, 2026 · 2026-04-30T12:30:00 | Ann Dennison | pending | Full-year 2026 results are not yet in the supplied call history. |
Q&A pressure map
Question counts and firms are curator tallies; analyst coverage shown above.
| Topic | Questions | Firms | Pressure / response |
|---|---|---|---|
| Signature model and the 2026 PBM income decline | 5 | JPMorgan, Wolfe Research, UBS, Barclays, BofA Securities | The Q3 2025 call, which introduced the rebate-free model and flagged a 2026 Pharmacy Benefit Services decline, drew the heaviest questioning. Analysts pushed for the magnitude of the decline and 2026 EPS; management gave only directional commentary and explicitly declined to quantify either. |
| Stop-loss margin miss and repricing | 6 | Wolfe Research, Wells Fargo, TD Cowen, Stephens, Barclays, Deutsche Bank | The Q4 2024 miss made stop-loss the dominant line of questioning, with analysts probing the size of the shortfall, the pace of repricing, and why the margin recovery extends into 2027. |
| Medicare Advantage divestiture rationale | 5 | UBS, Wells Fargo, Nephron Research, Stephens, Wolfe Research | When the HCSC sale was announced on the Q4 2023 call, analysts pressed the rationale for exiting a business management still described as attractive and the implications of ceding control of internal medical spend. |
| Exchange exit and eviCore review | 2 | BofA Securities, Morgan Stanley | On the Q1 2026 call, questions centered on capital freed by the exchange exit and whether the eviCore review was proactive or prompted. Management said both actions were proactive with no transaction to discuss. |
Language shifts
Only language evidence verified against the referenced component is shown.
| Observation | Verbatim evidence | Call ID | Component |
|---|---|---|---|
| A candid admission of a miss that broke from the steady "in line with expectations" cadence of the prior 2023–2024 calls, with the shortfall concentrated in stop-loss. | “we're disappointed by the shortfall that we reported in the fourth quarter.” | 1916608175 | 6 |
| Management framed elevated high-cost-claimant pressure as durable rather than transient, a more structural read of cost trend than earlier calls conveyed. | “So we see it as more of a structural shift than something that's temporary.” | 1916608175 | 49 |
| New forward caution specific to the PBM segment, introduced alongside the rebate-free Signature model and its transition costs. | “we expect margin pressure within our Pharmacy Benefit Service segment over the next 2 years.” | 1962900714 | 2 |
| By Q1 2026 the cost-trend language turns modestly more constructive — still elevated, but explicitly not accelerating and framed as potential upside. | “On the positive side, they have not accelerated. They remained elevated.” | 1993036685 | 34 |
Across the history, Cigna is steadily shifting its center of gravity from insurance toward services and specialty, executed through disciplined pruning — group life, then Medicare, and now exchanges and possibly eviCore. Execution against the EPS algorithm has been reliable apart from the stop-loss-driven 2024 miss; the open question the transcripts leave for the debate is whether the rebate-free Signature transition can absorb near-term PBM margin pressure without denting the long-run algorithm as Evanko takes over.
Competitors describe The Cigna Group's market in their own filings and calls. These verified passages and visual pages show where their strategies meet, using source documents preserved in Sources.
CVS Health (CVS)
Cigna's closest structural mirror: CVS pairs Aetna (health plans) with Caremark (PBM) exactly as Cigna pairs Cigna Healthcare with Evernorth's Express Scripts, and its 10-K names Cigna's Express Scripts by name as a PBM competitor.
CVS Health's FY2025 10-K lists the primary competitive factors in health services and names “the Express Scripts business of Cigna Corporation” among the PBM competitors to its Caremark segment.
The Company believes the primary competitive factors in the health services industry include: (i) the ability to negotiate favorable discounts from drug manufacturers as well as to negotiate favorable discounts from, and access to, retail pharmacy networks; (ii) the ability to identify and apply effective cost management programs utilizing clinical strategies, including the development and utilization of preferred formularies; (iii) the ability to market PBM and other health products and services […] The Health Services segment has a significant number of competitors offering PBM services, including large, national PBM companies (e.g., Prime Therapeutics and MedImpact), PBMs owned by large national health plans (e.g., the Express Scripts business of Cigna Corporation and the Optum Rx business of UnitedHealth Group) and smaller standalone PBMs.
p. 24 · Read in context →
CVS Health's pharmacy chief characterizes Caremark as “the leader in the PBM in the marketplace” with an “upper 90% retention rate” heading into the 2026 selling season Cigna's Express Scripts also bids in.
Prem Shah, Group President: We’re really pleased with the strong start to the 2026 PBM selling season. Caremark continues to be well positioned as the leader in the PBM in the marketplace. What I’d say is we’re continuing to be focused on driving what our clients value the most, which is making prescriptions and pharmacy costs more affordable and lowering the cost by increasing competition. On the retention side, we’re on track with where we normally are, with our historical upper 90% retention rate. The PBM industry has always been competitive. We remain to have the same discipline we’ve always had in our pricing and in the marketplace.
p. 11 · Read in context →
CVS Health's CEO frames Caremark's TrueCost net-cost pricing model as a first move that “others are following,” citing more than 25 million members in point-of-sale rebate programs.
David Joyner, President and CEO: As the leading health care consumer company, we’ve been working diligently for years to lead with greater transparency and savings for consumers at the pharmacy counter. We were at the forefront of this transition with more than 25 million members who benefit at the pharmacy counter from our lowest net cost through point-of-sale rebates. […] Two years ago, we continued our innovation leadership when we introduced our new TrueCost model, which guarantees a net cost for each individual drug, delivering drug pricing transparency for our clients and consumers. We are encouraged by recent announcements that others are following us on this path.
p. 1 · Read in context →
UnitedHealth Group (UNH)
The largest US health insurer and, through Optum Rx, Express Scripts' biggest head-to-head PBM rival; its own disclosures size the drug-spend pool and stake out the transparency/rebate-pass-through ground Cigna's Evernorth also competes on.
UnitedHealth's FY2025 10-K sizes Optum Rx at $188 billion of pharmaceutical spend managed in 2025, including nearly $87 billion of specialty — the same pool Cigna's Express Scripts and Accredo manage.
Optum Rx manages a broad range of prescription drug spend, including widely available retail drugs as well as limited and ultra-limited distribution drugs in oncology, human immunodeficiency virus, pain management and ophthalmology. Optum Rx serves the growing pharmacy needs of people with behavioral health and substance use disorders. In 2025, Optum Rx managed $188 billion in pharmaceutical spending, including nearly $87 billion in specialty pharmaceutical spending
p. 7 · Read in context →
Optum Rx's stated pivot to fee-based pricing and a commitment to pass through 100% of manufacturer rebates by 2027, with retention it describes as “high 90s.”
Patrick Conway, CEO, Optum: Turning to Optum Rx. For a few years now, we have been leading an industry-wide shift towards transparency and fee-based services, where we are delivering affordability and better outcomes regardless of pricing structure. That's why we continue to win new customers and retain existing ones, with retention rates in the high 90s. In May, we announced a new pharmacy care approach based on monthly per-member fees with full PBM and GPO fee transparency and enhanced consumer tools. Client feedback has been positive and focused on how greater transparency and clinical alignment can address trend challenges, shifting the conversation to affordable health outcomes versus economic guarantees. This all builds on our industry-leading commitment last year to pass through 100% of manufacturer rebates to customers by the end of 2027. We are well on our way, as we expect to end 2026 with more than 95% of clients on 100% pass-through.
p. 3 · Read in context →
Optum Rx's stated first-quarter client wins (more than 800 new clients onboarded) and its claim that specialty drugs now exceed 50% of drug spend.
Patrick Conway, CEO, Optum: Moving to Optum Rx. We started the year by onboarding more than 800 new clients while reducing contact call center volume by 25% through enhanced digital and AI-enabled self-service, with member satisfaction over 95%. Our unique PreCheck Prior Authorization capability reduces prescription approval time from over 8 hours to under 30 seconds and provides a 68% reduction in denials due to missing information and an 88% reduction in appeals, easing interaction for clients, members, and providers. First quarter utilization and drug cost trends were as expected, with scripts down slightly year-over-year reflecting some membership mix and attrition. As manufacturers continue to implement significant drug price increases, and with more complex specialty drugs representing over 50% of drug spend, the role of pharmacy care is more important than ever in helping patients access affordable drugs.
p. 3 · Read in context →
Elevance Health (ELV)
A Blue Cross Blue Shield insurer building CarelonRx into a full PBM and an in-house specialty pharmacy pointed squarely at Express Scripts and Accredo; its filings also record a direct legal collision with Cigna's Express Scripts.
CarelonRx's stated 2026 selling-season national-account wins and a claimed $100 per-member-per-month saving from an integrated medical-pharmacy model — the same integration thesis Cigna markets across Evernorth and Cigna Healthcare.
Mark Kaye, Chief Financial Officer: Carelon Rx delivered a strong ASO selling season for 2026. We had several national account wins and improved win rates across both the middle market and large group. That performance reflects growing demand for a more integrated medical-pharmacy model and for some of the differentiated value Carelon Rx brings to employers and our health plan partners. Sales momentum remains strong. Total sales to date are running ahead of plan including two marquee national wins, highlighting our ability to compete upmarket successfully for large sophisticated clients. […] For clients with aligned medical-pharmacy benefits we have seen savings upwards of $100 per member per month as well as significantly fewer ER visits and a reduction in some high-cost specialty drug administration.
p. 4 · Read in context →
Carelon's stated specialty-pharmacy build-out on the BioPlus platform, including migrating Kroger Specialty Pharmacy prescriptions — volume it is capturing in Accredo's specialty niche.
Peter Haytaian, President of Carelon: Our specialty strategy is a key part of the diversification strategy we're implementing in pharmacy, and we're very excited about it. We are committed to promoting whole health, enhancing affordability and simplicity, and focusing on the patient experience. This strategy is vital for our long-term growth. We're making significant progress with it. We began with the BioPlus platform and are continuing to shift prescriptions to that platform. Last year, we acquired Kroger Specialty Pharmacy, and we're on track to transition those prescriptions by the end of this year, which is progressing well.
p. 9 · Read in context →
Elevance's FY2024 10-K recounts Anthem, Inc. v. Express Scripts, its suit seeking over $14,800 (thousands) for pharmacy pricing above competitive benchmarks — a direct dispute with the PBM Cigna now owns.
In March 2016, we filed a lawsuit against Express Scripts, Inc. (“Express Scripts”), our vendor at the time for pharmacy benefit management services, captioned Anthem, Inc. v. Express Scripts, Inc., in the U.S. District Court for the Southern District of New York (the “District Court”). The lawsuit sought to recover over $14,800 in damages for pharmacy pricing that is higher than competitive benchmark pricing under the agreement between the parties (the “ESI Agreement”), over $158 in damages related to operational breaches
p. 186 · Read in context →
Humana (HUM)
The leading Medicare Advantage insurer, now pushing CenterWell specialty pharmacy and GLP-1 distribution into Evernorth's and Accredo's turf while defending the senior-market share Cigna Healthcare's government business contests.
Humana's stated CenterWell specialty-pharmacy growth, including new GLP-1 direct-to-consumer partnerships with Ro and Weight Watchers — encroaching on the specialty-pharmacy niche Evernorth's Accredo serves.
Celeste Mellet, Chief Financial Officer: In the Specialty Pharma sector, specifically within the CenterWell Pharmacy business, our strong performance this year is largely due to strategic changes in how we organize and market that business. We have made significant investments in establishing robust partnerships with pharmaceutical companies, which has led to new opportunities through our direct-to-consumer model. For example, we have formed new partnerships with Ro and Weight Watchers to sell some GLP-1 products, and we anticipate seeing more of this type of business in the future.
p. 7 · Read in context →
Humana's stated 2026 AEP Medicare Advantage growth of roughly 1 million members (20%), with over 70% of new sales switchers from competitor plans.
James Rechtin, President and CEO: Third, let me provide an overview of our growth and why we like the growth. We grew by approximately 1,000,000 members or 20% in AEP. Our retention rate improved over 500 basis points year over year. And I'm going to keep emphasizing that that is good growth. Over 70% of our new sales were switchers from competitor plans. On average, switchers have better economics.
p. 2 · Read in context →
Humana's FY2025 10-K states its scale at roughly 15 million medical members and 4.7 million specialty members, with 83% of revenue from federal government contracts concentrated in Medicare Advantage.
As of December 31, 2025, we had approximately 15 million members in our medical benefit plans, as well as approximately 4.7 million members in our specialty products. During 2025, 83% of our total premiums and services revenue were derived from contracts with the federal government, including 14% derived from our individual Medicare Advantage contracts in Florida with the Centers for Medicare and Medicaid Services, or CMS, under which we provided health insurance coverage to approximately 1.0 million members as of December 31, 2025.
p. 4 · Read in context →
Centene (CNC)
The nation's largest ACA Marketplace and Medicaid insurer; Cigna's clearest overlap with Centene is the individual-exchange line, where Centene's leadership and post-subsidy pricing choices reshape the risk pool Cigna also sells into.
Centene's FY2025 10-K claims the largest ACA Marketplace position — 5.5 million Ambetter members across 29 states — while flagging the year-end 2025 expiration of enhanced APTC subsidies.
Temporary enhanced subsidies were made available by the American Rescue Plan Act (ARPA), which were further extended through 2025 pursuant to the IRA. The enhanced eligibility extended by the IRA expired at the end of 2025. While enhanced eligibility has expired, APTCs are still in force and provide meaningful subsidies to eligible members. We are the largest Marketplace carrier, serving 5.5 million members across 29 states as of December 31, 2025, under the brand name Ambetter Health. Revenues from CMS are significant to the segment.
p. 13 · Read in context →
Centene's stated exchange-pricing posture — a deliberate decision not to price as aggressively as competitors — and its claim to retain higher-acuity Silver members after enhanced-APTC expiration.
Sarah London, Chief Executive Officer: It also, as we've seen, drove a shift across the market from Silver membership into Bronze products as consumers looked for more affordable plans. And so as a result, the Silver tier remaining membership really follows the golden rule of risk pools that when it strengthens, it becomes more and more concentrated in higher acuity members. And so given our market size, our Silver footprint and, frankly, our intentional decision not to go as hard on aggressive pricing strategy, which we still very much stand by, we were positioned to retain and attract more Silver members who are now more acute in that overall post-APTC environment.
p. 6 · Read in context →
Molina Healthcare (MOH)
A government-programs managed-care insurer (Medicaid, D-SNP, Marketplace); its collision with Cigna is in the ACA exchange, where Molina is deliberately ceding share, and in Medicaid procurement scale.
Molina's stated ACA Marketplace retrenchment — repricing up ~30% and cutting its #1/#2 county footprint from 50% to 15% — with membership expected to fall from 650,000 toward the low-200,000s.
Joseph Zubretsky, Chief Executive Officer: But as you recall, we ended the year with 650,000 members. We priced up 30% on average, ranging from 15% to 45%, consciously reduced our #1 and #2 position from 50% of our counties to 15% and reduced our footprint by 20%, a conscious effort as we will not allocate capital to an unstable risk pool. Our speculation or forecast at the time was we would come down into the 200,000 zone, 200,000 to 300,000 and reduce our revenue to $2.2 billion.
p. 10 · Read in context →
Molina's stated Medicaid procurement record — 90% renewal and 80% new-contract RFP win rates, over $9 billion of recent wins, and a $50 billion pipeline.
Joseph Zubretsky, Chief Executive Officer: The significant win in Florida in our previously announced Georgia and Texas star ship wins represent over $9 billion of Medicaid premium and significantly contribute to our embedded earnings. Since we embarked on this growth strategy, we have achieved an RFP win rate of 90% on renewal contracts, representing $14 billion in retained revenue and 80% on new contracts representing $20 billion of new revenue. We are engaged in active RFPs in several states and have an active pipeline of $50 billion of new opportunities over the next few years.
p. 1 · Read in context →
More peer documents
Q4_FY2025 — 13 pages · CEO quantifies over $280 billion of combined Aetna network and Caremark drug-negotiation savings, and details the Cordavis biosimilar unit — the dual-engine scale claim that parallels Cigna's structure. · Open →
CVS_annual_report_FY2024 — 340 pages · Prior-year 10-K carries the same Health Services competition paragraph naming “the Express Scripts business of Cigna Corporation,” for a year-over-year read. · Open →
UNH_annual_report_FY2024 — 118 pages · Prior-year 10-K with Optum Rx managed-spend and adjusted-script figures for a year-over-year benchmark against Express Scripts' scale. · Open →
Q4_FY2025 — 13 pages · Fuller-year Optum Rx commentary on PBM transparency, specialty mix and drug-cost trend around the 2026 selling season. · Open →
ELV_annual_report_FY2025 — 230 pages · Latest 10-K describes CarelonRx's full PBM service portfolio (formulary, rebate administration, specialty, home delivery) sold to affiliated and external clients, plus updated medical membership. · Open →
Q3_FY2025 — 12 pages · CEO describes extending CenterWell GLP-1 pharmacy from direct-to-consumer into direct-to-employer, and PDP growth from below-benchmark bids capturing competitor reassignments. · Open →
Q2_FY2025 — 14 pages · CEO answers analysts on exchange competition, claiming the largest combined Medicaid and Marketplace book and signaling intent to use that scale on market-wide pricing rules. · Open →
MOH_annual_report_FY2025 — 102 pages · 10-K lays out the OBBBA Medicaid-expansion cuts and expiring ACA subsidies reshaping the public-program and exchange risk pools Cigna also serves. · Open →
Does Cigna fit the system?
Leans toward fitting the framework; watchlist-only: no qualifying long-dated options; contested: P1, P2
Cigna clears the universe screen and trips none of the hard exclusions; the dislocation, yield, self-help and diagnosis pillars land on the fit side of the reference lines. Confidence is low: the name-masked juror flipped the year-10 gate (P1) to not-met — the prior-driven-risk trigger. Two pillars are contested, durability (P1) and FCF consistency (P2), and no qualifying long-dated options could be verified from a citable source, so the framework's watchlist-only rule applies.
The verdict below renders the deterministic tally. It is not overturned, softened, or extended here; every number keys to a surviving claim or a tally entry.
Market cap ($B)
Peak-to-trough drawdown
Adjusted FCF yield (FY2025)
Trial: temporary probability
Sources: market cap and drawdown derived from company filings and price feed, as reported; adjusted FCF yield derived from FY2025 cash-flow statement [1]; temporary probability from the blind three-judge trial.
Universe and exclusions
The universe screen passes on both lines. Cigna is US common stock on the NYSE (ticker CI, incorporated in Delaware in 1981) — a domestic common share, not an ADR and not a Chinese issuer [2]. Market capitalization is roughly $76.5B — 268.563M shares at $284.85 on 2026-07-22 — about 7.6x the $10B floor even after the sector de-rating. Both criteria are met.
No hard exclusion hits; the tally records an empty exclusion list. Here is what was checked, and why each clears:
- Auto / OEM (X1): not triggered. Cigna is two segments — Evernorth Health Services (pharmacy benefits) and Cigna Healthcare (medical benefits) — with no vehicle, hardware, or capital-goods line [3].
- Market darling (X4): not triggered. At 12.8x FY2025 EPS ($284.85 / $22.18) and 0.28x sales, Cigna is the cheapest positive multiple in its large managed-care peer group — below Elevance (15.4x) and far below UnitedHealth (32.6x) and Humana (40.4x). This is the opposite of a consensus-owned story; the counter is that low price/sales is structural to pass-through managed care and carries little darling signal, so the low P/E is the informative gauge.
- Structural decline (X3): not triggered. Revenue rose in all nine year-over-year steps, from $39.8B (FY2016) to $274.9B (FY2025), with zero consecutive-decline years [4]. The counter-fact in the same breath: two of the largest steps are inorganic — the FY2019 Express Scripts consolidation and the FY2024 Centene PBM contract (Pharmacy Benefit Services revenue +46%) — but no single-year revenue decline appears anywhere in the record.
- China dependence (S1): flag raised and cleared. China is a 50%-owned equity-method insurance JV carrying a negative ~$(0.3)B book value and no consolidated revenue [5]; International Health premiums are ~1.5% of revenue [6]. Foreign operations were ~53% of 2025 pre-tax income [7], which sounds large, but that reflects international tax structuring and a depressed 2024 domestic base, not China revenue or assets.
- Promotional CEO (X2): not triggered. On the five most material 2024–2026 commitments management missed only the 2024 stop-loss EPS target ($27.33 vs at-least-$28.40, called a disappointment) [8] and kept or exceeded the rest; CEO Cordani owns 0.23% of shares under an 8x-salary holding rule [9] and bought stock in the open market near the October 2025 low [10]. The counter: 0.23% is a professional-manager stake, not founder-scale skin in the game.
Pattern match
This fits the reader contract's third setup — healthcare / insurance forecasting errors — the pattern whose own precedents name Centene ($90 to $25 on a guidance cut, recovered toward $60) and "the cheaper twin over the darling (Cigna over UNH)." The pattern's specific checks:
- A repricing mechanism exists. Stop-loss and individual-exchange books reprice every 1 January — the same books whose 2024 cost overrun drove the drawdown — and the 2026 round is booked and guided to a 83.7%–84.7% medical care ratio [11].
- Regulatory friction gates entry. Insurer and HMO licensing and NAIC risk-based-capital minimums bar casual entry [12] [13] — the same apparatus that now legislates PBM economics onto a fee basis.
The reset was a forward-trajectory downgrade rather than a current-year miss: the deepest single day (30 Oct 2025, -17.4%) was a beat on the quarter that reaffirmed 2025 guidance while resetting the 2026 Evernorth/PBS growth path [14]. That is the pattern's signature, with one honest departure from it — see Clock: the sell side never capitulated.
The pillar ledger
Source: deterministic tally (ruchir/fit_tally.json); pillar arithmetic from the surviving claims cited in each treatment below.
Year-10 durability (P1) — contested
The gate is contested: the two Claude jurors read it met, the two Codex jurors not-met (trimmed-mean probability 0.735, spread 0.08), and the name-masked probe flipped it to not-met. The fit-side arithmetic is a three-firm pharmacy-benefit oligopoly, insurer and PBM licensing barriers, revenue that rose every year to $274.9B, and forward consensus FCF near $9–10B through FY2029; Evernorth supplies 83% of segment revenue but only 64% of pre-tax income at a ~3.1% margin [15], with ACA minimum-MLR floors and RBC capital gating entry [16].
The strongest surviving counter-fact sits in the same breath, and it is why conviction on the free-cash-flow leg is capped rather than maximal: federal law effective 2028 prohibits Part D PBM compensation "directly or indirectly linked to the list price" and requires PBMs to "remit 100% of certain rebates, fees and other remuneration to plan sponsors" [17], and Cigna concedes such reform "may adversely affect our ability to price our pharmacy products and services appropriately" [18]. The exposed Pharmacy Benefit Services unit earned about 31% of FY2025 pre-tax adjusted income ($3,506M of $11,374M); retained rebates are estimated under a tenth of Evernorth pre-tax profit, the phase-in runs to 2028–2029, the FTC matter settled in February 2026 without penalty [19], and Cigna is pre-empting the change with a "no rebate, no spread, fully transparent" fee-based model [20]. The full treatment is on Durability.
FCF consistency (P2) — contested
Contested for a different reason: the two Claude jurors read it met, the two Codex jurors could not determine it. The framework's own adjusted-FCF stability metric is not computable — stock-based compensation is missing for FY2016–2019, so no five-year adjusted-FCF window exists — which is the datapoint the two Codex jurors flagged as missing. Assessed on the available proxy, operating cash flow is always positive and range-bound at roughly $7–12B after 2019 with zero negative years [21]. The counter-fact carried in the same treatment: the verdict-bearing feature itself is unavailable, so the rolling-average stability the framework specifies cannot be measured directly; and Cigna lacks the healthy 5–8 year underwriting-loss cadence the framework treats as a positive for banks and insurers. See Durability.
Dislocation and yield (P3) — met
All four dislocation-and-yield criteria are met. The drawdown runs on dated triggers — a two-year PBM margin reset at Q3 2025 and a whole-industry PBM political selloff in December 2024 — for a 33.4% peak-to-trough fall ($366.85 to $244.41). The capitulation gauge is the honest weak spot: sustained 20-day volume peaked at only 2.12x the pre-peak median, short of the 3–5x that marks forced selling, though the single session of 30 Oct 2025 spiked to ~7.4x before fading. On the framework's adjusted basis, FY2025 adjusted FCF of $7,496M yields 9.80% on $76.5B — 20 bps under the 10% moderate-balance-sheet bar — while the three-year average of $8,358M yields 10.93%, straddling the line; the adjustment nets SBC of $291M against reported FCF [22]. The forward path clears it (P3d probability 0.775, spread 0.03): consensus vendor FCF of $9.0–10.3B in FY2026–FY2028 yields 11.8–13.4%. The counter-fact: a plainer cash-from-operations-less-capex proxy yields only ~9.1% in FY2025 before crossing later, so whether the near-term forward yield clears 10% depends on which FCF definition proves truer. Full workings on Dislocation and Yield.
Balance sheet and self-help (P4) — met
Both live criteria are met; dividend safety (P4c) is not applicable. FY2025 net debt of $22.7B against ~$12.4B EBITDA is 1.84x — moderate, which selects the 10% bar — with only $550M due in 2026 and $2,359M in 2027 against ~$8.4B of annual free cash flow [23] [24]. The repurchase engine is real and executed: Cigna spent $3.6B, $7.0B and $2.3B on buybacks in 2025/2024/2023 and cut its share count 29% from a 379.8M post-Express-Scripts peak to 268.6M, with SBC of only $291M a fraction of repurchases — clearing the framework's hard-fail test for a rising share count [25]. The counter-fact: the buyback cadence is lumpy (halving from $7.0B to $3.6B), and the September 2025 refinancing repriced debt to 4.5%–6.0% coupons above the sub-3% notes it replaces, so interest expense drifts up as the book rolls. Full treatment on Self-Help.
Diagnosis — temporary over permanent (P5) — met
The diagnosis criterion is met (probability 0.62, spread 0.10). The blind three-judge trial ruled the damage temporary over permanent at a 0.62 probability, with an order-stability gap of 0.02 (temporary-first mean 0.62, permanent-first mean 0.64) — not contested. The price erased ~$27.5B of market value from the peak, while the near-term problem plausibly destroys only $0.7–8.8B of NPV under conservative assumptions, leaving a gap of roughly $19–27B [26] [27]. The strongest surviving counter-fact: if the PBM re-rating is deeper than the disclosed Q1 2026 run-rate implies — Evernorth margin already fell 5.3% to 3.1% since 2019 — and terminal growth re-bases negative, intrinsic value could approach today's price; at $284.85 the market already implies about -1.3% perpetual earnings growth [28]. Both cases are argued fairly on Damage Math.
Instrument context (I1) — not verifiable
The instrument criterion is not verifiable, and this is what drives the watchlist-only flag. The Clock tab surfaced web-sourced facts — listed options extending to January 2028 (~18 months out) and 30-day implied volatility of 39.9% as of 21 July 2026, below the ~50–55 reference line — but those facts are not anchored to any filing, so the verification layer could not confirm them from a citable corpus source. The framework's own rule then governs: absent verified qualifying long-dated options, the name is a watchlist candidate, not a live one. Stated as a framework fact, not advice.
What a re-rating would require
The framework's target test — the price implied by valuing normalized adjusted free cash flow at the applicable bar yield — cannot be computed deterministically here. The tally returns re-rating math as unavailable: "Re-rating math unavailable because the applicable bar or normalized adjusted FCF is missing." Adjusted FCF is not_computable in the feature file (SBC absent for FY2016–2019), so neither the normalized adjusted-FCF base nor the implied market cap at the bar is machine-derived.
The closest available reconstruction, carried on Yield, is a three-year average adjusted FCF of $8,358M against the 10% moderate bar — a 10.93% yield, implying the current $76.5B market cap already sits near fair on a bar-yield basis, so the re-rating case rests on multiple recovery rather than a deep-yield entry. Consensus forward FCF at 11.8–13.4% and consensus EPS re-accelerating from ~$30.4 (FY2026) to ~$41.9 (FY2029) is what the sell side already models; the setup asks the buy side to concede that the 2026 pause is not permanent.
Base-rate context from Clock: in the modern managed-care-scale era, Cigna drawdowns of comparable depth round-tripped in roughly 11–36 months.
Source: derived from Cigna price history, as reported; current episode drawdown from the capitulation gauge.
The median completed round trip is ~19 months; the current episode has already run ~22 months from its September-2024 peak with price still 22% below it, tracking the slower end. Stated as arithmetic against the framework's own reference lines — not a recommendation.
Contested and undetermined
P1 (year-10 durability) — contested. Both readings survived. Fit-side: revenue and adjusted FCF more likely than not higher on a three-firm oligopoly and licensing barriers, with forward consensus FCF near $9–10B. Not-fit side: 2028 federal delinking and 100% rebate pass-through reshape the economics of Pharmacy Benefit Services, ~31% of FY2025 pre-tax adjusted income, capping free-cash-flow-leg conviction. Vote split 2 met (Claude) / 2 not-met (Codex); trimmed-mean probability 0.735, spread 0.08; masked verdict not-met.
P2 (FCF consistency) — contested. Fit-side: ten-year operating cash flow always positive, range-bound $7–12B post-2019. Undetermined side: the framework's adjusted-FCF stability metric is not computable — the missing datapoint is a complete five-year adjusted-FCF window with SBC for FY2016–FY2019 — so two of the four jurors returned cannot-determine rather than a verdict. Vote split 2 met / 2 cannot-determine.
No criterion aggregated to a cannot-determine verdict.
Provenance
Source: deterministic tally provenance block (ruchir/fit_tally.json), as computed.
Two model families sat the jury — Claude in two seats, Codex in two — and their split on the P1 gate, plus a name-masked probe that flipped that same gate to not-met, is exactly what caps confidence at low; the tally records the basis as name-mask divergence or load-bearing probability divergence exceeding 0.20. The evidence trail was pressed hard: of 17 fully checked claims, 12 survived, 2 were weakened to a narrower reading, none were refuted, and 3 were unverifiable from the corpus (chiefly the web-sourced instrument facts and the external PBM concentration figure).
The falsifier ledger
These are the standing conditions that would change the read. The ledger carries several jurors' restatements of the same underlying conditions; each is preserved verbatim.
Framework templates:
- adjusted FCF or EBITDA declines where flat-or-better was underwritten
- revenue declines for a third consecutive year
- capital allocation pivots to debt paydown over repurchases
- share count inflects upward
- the industry repricing cycle fails to materialize where industry-wide mean reversion was underwritten
Name-specific, with thresholds and windows:
- FY2026 (Jan 2027): Cigna Healthcare MCR prints above 84.7% or consolidated EPS below $30.25 — stop-loss repricing failed to stick.
- FY2026-27: Evernorth/PBS absolute pre-tax income declines year-over-year beyond the disclosed transitional costs — the compression is structural, not investment spend.
- Post-Aug-2028: after rebate remittance and Part D delinking take effect, PBM margin steps down and does not recover, and enterprise FCF/EPS stall.
- Medical customers fall materially below ~18M beyond the deliberate exchange exit — franchise erosion, not portfolio shaping.
- FY2026 Cigna Healthcare MCR above 84.7% or adjusted EPS below $30.25, showing repricing failed.
- FY2027 Pharmacy Benefit Services pre-tax adjusted income declines despite transition spend no longer becoming a year-over-year headwind.
- By year-end 2028, Evernorth rebate-free adoption is materially below 50% or retention falls below 95%.
- Post-2028 PBM profit per claim remains below 2025 levels after rebate-remittance and delinking are fully implemented.
- FY2026 (reported Jan 2027): Cigna Healthcare MCR prints above 84.7% or adjusted EPS lands below $30.25 — repricing failed to stick.
- FY2027: EverNorth pre-tax adjusted earnings decline year-over-year and margin stays below ~3.3% after transition spend rolls off — investment framing was cover for a structural reset.
- Rebate-free/fee model or 2028 regulation drives PBS profit-per-claim materially below the 2025 base with retention slipping under ~95% — economics genuinely re-based lower.
- Total medical customers fall well below ~18M and keep falling beyond the deliberate exchange exit — franchise erosion, not portfolio shaping.
Data gaps
What the run could not answer:
- Adjusted FCF, adjusted FCF yield, balance-sheet class and float-retirement years are not_computable in the deterministic feature file (missing SBC for FY2016–2019 and a clean FY2025 debt/cash pair); every adjusted figure here is reconstructed from filed cash-flow statements and notes and flagged as derived.
- The rolling five-year adjusted-FCF stability series — annual SBC and a five-year acquisition window — does not exist in the corpus, so the P2 stability metric could not be scored on the framework's own basis.
- Year-10 (FY2035) is beyond all filed guidance and sell-side consensus (which runs to FY2029), so the free-cash-flow-leg conviction rests on structural reasoning about post-2028 PBM economics rather than a filed figure.
- The ~80%-of-claims PBM concentration and the "retained rebates under a tenth of Evernorth pre-tax" magnitude rely on external/web sources; filings establish the three-firm structure qualitatively but do not quantify it.
- Reported short interest and holder-level disclosures returned no rows for CI, so seller identity (forced/anchored vs informed) cannot be evidenced directly.
- Point-in-time CapIQ estimate-revision history is not in the corpus (only a current consensus snapshot), so the exact date-by-date path of estimates versus price cannot be plotted.
- Exact option open-interest and implied volatility by expiry were not obtained from a citable source; instrument availability is web-sourced and unverified, which is what places the name on watchlist-only footing.
- The stop-loss ~100 bps margin-recapture commitment (2026–2027) and the FY2026 EPS guide are still pending in the supplied call history, so their outcomes cannot yet be verified.
Business
The Cigna Group is a US-listed ($76.5B market cap, NYSE: CI) global health company that runs two engines: Evernorth, one of the three national pharmacy-benefit managers, and Cigna Healthcare, a medical-benefits insurer. FY2025 revenue was $274.9 billion. It clears both universe lines — US common stock, market cap far above the $10B bar. It is not an auto maker and not a consensus darling: at 12.8x earnings it is the cheapest large managed-care name in its peer group.
What Cigna is, in two sentences
The Cigna Group sells two things. Through Evernorth Health Services it manages other payers' and employers' drug spend — negotiating prices, running mail-order and specialty pharmacies, and processing prescription claims at national scale; through Cigna Healthcare it sells and administers medical insurance, increasingly as a fee-based administrator of self-funded employer plans rather than a risk-taker. A global workforce of roughly 67,700 serves more than 185 million customer relationships across more than 30 markets, alongside about 1.7 million provider relationships [1].
The company was incorporated in Delaware in 1981 through predecessor insurers and renamed from Cigna Corporation to The Cigna Group in February 2023 [2] [3] — a long operating history that P1 durability leans on (Durability).
FY2025 Revenue ($M)
Market Cap ($M)
FY2025 Net Income ($M)
Diluted EPS ($)
Employees
Customer Relationships (M)
Source: FY2025 Annual Report (Form 10-K), Item 1 Business [4] and consolidated financials as reported; market cap at $284.85 on 2026-07-22 (fit_features.market_cap_usd).
The two engines — a large thin-margin pharmacy business and a smaller fat-margin insurer
The two segments are economically opposite. Evernorth is high-volume, low-margin: it books adjusted revenues of $234.9 billion (Pharmacy Benefit Services $132.1B plus Specialty and Care Services $102.8B) on pre-tax adjusted income of $7.2 billion — a 3.1% pre-tax margin — while processing 2,222 million adjusted scripts a year [5]. Cigna Healthcare is a quarter of Evernorth's revenue but earns a far richer margin: $47.2 billion of adjusted revenues at $4.15 billion pre-tax income — an 8.8% pre-tax margin, on a medical care ratio of 84.4% [6].
Source: FY2025 Annual Report (Form 10-K), MD&A — Evernorth p.80 [7] and Cigna Healthcare p.82 [8].
The result: Evernorth is 83% of segment revenue but only 64% of segment pre-tax income; Cigna Healthcare's smaller book carries the profit density. For a durability read, that matters — Evernorth's economics rest on scale and negotiating leverage in a pass-through business, while Cigna Healthcare's rest on underwriting and the medical-cost reserve that defines any managed-care income statement.
A second structural fact sits inside Cigna Healthcare: of 18.1 million medical customers — down 5% year over year after the 2025 exit of Medicare Advantage — 14.3 million (79%) are administrative-services-only, self-funded employer members on which Cigna earns a fee and bears no insurance risk; only 3.8 million (21%) are insured lives where Cigna holds the claims risk [9]. Cigna is, more than its peers, a fee-based administrator rather than a risk-bearer.
Where the revenue and the geography sit
By source, the top line is a pharmacy business with an insurance business attached: Evernorth generated $219.4 billion of pharmacy revenues in FY2025 against $39.7 billion of Cigna Healthcare premiums [10].
Source: FY2025 Annual Report (Form 10-K), Note 23 Segment Information — Revenue Disaggregation [11].
Geographically the business is overwhelmingly domestic. International Health premiums were about $4.1 billion — roughly 1.5% of total revenue — serving globally mobile individuals and local markets including China, Singapore, Hong Kong, Spain, India and the Middle East [12]. One nuance for the reader: pre-tax income from foreign operations was about 53% of consolidated pre-tax income in 2025 (62% in 2024, 48% in 2023) — a figure inflated by international tax structuring and by a 2024 US impairment that depressed domestic earnings, not by a foreign-heavy revenue base [13].
China exposure — a sensitivity flag, quantified and immaterial (S1)
Cigna's only material China footprint is a 50%-owned insurance joint venture accounted for by the equity method — it contributes no consolidated revenue. Cigna's 50% share of the joint venture's investment portfolio was about $18.2 billion, but that is the JV's own balance sheet, not Cigna's; on Cigna's books the China JV carried a negative value of about $(0.3) billion at year-end 2025 after accumulated other-comprehensive-loss adjustments [14]. China is one of several small International Health markets, not a revenue or asset dependence. Against Ruchir's S1 test — heavy China revenue/asset reliance — the flag is raised and cleared: exposure is immaterial, and CI is US common stock, not a Chinese ADR.
Market structure — the P1 raw material
Cigna operates in two concentrated markets, both with high regulatory entry barriers. This is the evidence the Durability tab and the jury will lean on.
Pharmacy benefits: a three-firm oligopoly. The three largest PBMs — CVS Caremark, Cigna's Express Scripts (Evernorth), and UnitedHealth's Optum Rx — together process roughly 80% of US prescription claims (FTC staff findings, 2024–25). The concentration is confirmed inside competitors' own filings: CVS's FY2025 10-K names "the Express Scripts business of Cigna Corporation" and "the Optum Rx business of UnitedHealth Group" as its principal PBM competitors, alongside smaller players Prime Therapeutics and MedImpact [15], and UnitedHealth's FY2025 10-K sizes Optum Rx at $188 billion of managed pharmaceutical spend — the same pool Evernorth's Express Scripts and Accredo compete for [16]. Evernorth's own scale — $219.4 billion of pharmacy revenues on 2,222 million adjusted scripts — places it firmly among the three [17].
Health benefits: a national oligopoly. The commercial and government managed-care market is dominated by a handful of scaled insurers — UnitedHealth, Elevance, CVS/Aetna, Cigna, Humana and Centene. After divesting Medicare Advantage to Health Care Services Corporation in March 2025, Cigna Healthcare is now the smaller, commercial-and-international tilt of that group, competing chiefly on self-funded employer accounts.
Source: CVS FY2025 10-K p.24 [18]; Cigna FY2025 10-K Regulation, p.35–37 [19]; PBM concentration per FTC staff findings (2024–25).
Regulatory entry barriers are real and named. Cigna's insurance and HMO subsidiaries must be individually licensed by each jurisdiction in which they operate [20]; they are subject to NAIC risk-based-capital minimums that trigger regulatory intervention if surplus falls short, and to guaranty-fund assessments for insolvent peers [21]; and their insured medical plans face ACA minimum medical-loss-ratio rebate requirements [22]. A garage start-up cannot take this share; capital, licensing and regulated reserves gate the market — the kind of barrier Ruchir's P1 durability test weighs. The counter-fact is that the same regulatory intensity now points at the PBM economics: in February 2026 the FTC reached a settlement with Express Scripts over rebate transparency, a live pressure on the durability of Evernorth's margin that Durability carries.
Universe and first-pass exclusion screen
U1 — Listing. US common stock, NYSE: CI. Not an ADR, not a Chinese issuer. Clears the geography line.
U2 — Market cap. About $76.5B at $284.85 on 2026-07-22 — far above the $10B bar. Clears.
On the exclusion checks this tab can settle: Cigna is a health-services and insurance company, so the auto-OEM exclusion (X1) does not apply. On darling positioning (X4), it is the opposite of a consensus-saturated name. At $284.85 against $22.18 of FY2025 EPS, Cigna trades at 12.8x earnings — the lowest positive multiple in its peer set — and at 0.28x sales.
Source: prices as of 2026-07-22 and FY2025 reported EPS/revenue, as reported; P/E and P/S derived. Centene P/E not meaningful (FY2025 net loss). Managed-care price/sales runs low sector-wide because pass-through pharmacy and premium revenue inflates the denominator; the P/E is the more telling darling gauge.
Two reads follow. First, low price-to-sales is not a Cigna signal — every managed-care name screens under 1x sales because pass-through revenue dwarfs profit, so P/S carries little information here. Second, on the more telling earnings multiple, Cigna sits below Elevance (15.4x) and far below UnitedHealth (32.6x) and Humana (40.4x) — though the latter two are elevated by depressed 2025 earnings, not by enthusiasm. There is no "changes-the-future" narrative, no high multiple-to-sales relative to peers, and no bottom-left-to-top-right chart; the whole sector is out of favor. X4 is not a hit. Whether that cheapness reflects a deserved de-rating or a dislocation is not this tab's question — the Dislocation, Damage Math and Yield tabs carry it. The promotional-CEO (X2) and structural-decline (X3) checks belong to Self-Help and Durability and are not duplicated here.
Dislocation — what exactly happened to the price
The Cigna Group has a real, dated dislocation, but a moderate one. Shares fell 33.4% from a $366.85 peak (16 Sep 2024) to a $244.41 trough (31 Oct 2025) — 410 days, at least four distinct down-legs on identifiable managed-care and pharmacy-benefit triggers, not one crash. Traded volume elevated only to 2.1x its pre-peak median. Its notable feature: the price fell while forward earnings estimates held and rose — the framework's mispricing signature is present; the deep forced-selling washout is not.
The drawdown, quantified
Peak (16 Sep 2024)
Trough (31 Oct 2025)
Current (22 Jul 2026)
Peak-to-Trough
Days Peak→Trough
Source: peak, trough, current and depth are the deterministic capitulation gauge (derived: fit_features.capitulation_gauge.drawdown); prices from the company price feed, as reported.
Source: company price feed, month-end closes, as reported; peak and trough dates per fit_features.capitulation_gauge.
The fall is not one leg. From the September 2024 peak the stock lost roughly a quarter into late December 2024, recovered almost fully to $340 by April 2025, gave that back into a July 2025 low of $267, bounced to $311 by early October, then set its trough of $244.41 the day after third-quarter results. Each leg round-tripped part of the prior one; the drawdown is a series of repricings, not a single capitulation. Off the trough the stock has recovered 16.5% to $284.85, leaving it 22.3% below the peak.
The trigger — four dated legs
The event legs separate cleanly from drift. The initial September–October 2024 slide off $366.85 carried no company-specific event and normal volume — that first ~14% is drift, not the moment. What follows is four datable adverse events.
Source: price feed for levels and one-day/leg moves; triggers per company earnings calls (cited below) and reported market events.
Leg 1 — the industry PBM leg (Sept–Dec 2024). The largest leg is not Cigna-specific. Between early December 2024 and 19 December the stock fell from $330 to $274.80 (its 19 Dec close), part of a sector-wide selloff in pharmacy-benefit owners triggered by the 4 December killing of UnitedHealthcare's CEO, a bipartisan bill to force PBM–pharmacy divestiture, and the president-elect's public "knock out the middleman" remarks. These are reported market events, not Cigna filings; the corpus holds no primary Cigna document for them, so they are stated as such. This is the whole-industry repricing the framework treats as a promising setup — the mechanism is political and regulatory, applied to every large PBM at once.
Leg 2 — Q4-2024 results, 30 January 2025 (−6.7%). Alongside strong 2024 results, Cigna established a 2025 adjusted-EPS outlook of "at least $29.50" and disclosed that its stop-loss medical-care ratio would run above target for full-year 2025 [1], citing elevated medical costs in the stop-loss product within Cigna Healthcare [2]. The reaction was a first-order medical-cost worry, shared across the managed-care group that quarter.
Leg 3 — Q2-2025 results, 31 July 2025 (−10.2%). Management described elevated medical costs "throughout the year" [3] and noted stop-loss "remained elevated in the quarter, consistent with expectations," while reaffirming the full-year outlook of at least $29.60 per share [4]. The stock fell 10.2% to $267.38 on maintained — not cut — guidance: a de-rating of the multiple against a cost fear, not a cut to the number.
Leg 4 — Q3-2025 results, 30 October 2025 (−17.4%), the trough. The deepest single day paired a clear beat — revenue of $69.7 billion and adjusted EPS of $7.83 [5] — with a structural disclosure that reset forward expectations. Cigna announced a new rebate-free pharmacy model and said it expects "margin pressure within our Pharmacy Benefit Service segment over the next two years," while again reaffirming the 2025 outlook of at least $29.60 [6]. Management was explicit that "for 2026, Evernorth will not be on that long-term growth algorithm" [7]. The trigger is a change to the two-year earnings trajectory of the pharmacy-benefit segment (roughly 30% of enterprise earnings), not a miss on the current year — the stock closed at $247.10, with the $244.41 trough the following day.
The fear gauge
Volume Spike (20-day avg, ×median)
Peak Single Day (×median)
Pre-Peak Median Vol (M shares/day)
Source: volume-spike multiple is the deterministic gauge (derived: fit_features.capitulation_gauge.volume_spike); single-day multiple and pre-peak median computed from the price feed.
The measured capitulation gauge is 2.12x — the maximum 20-day average volume through the peak-to-trough leg, divided by the median daily volume in the 180 days before the peak. That is moderate, not a washout: it says traded volume ran roughly twice normal at its most sustained, well short of the 3–5x sustained surge that marks emotion-driven forced selling.
Two details qualify it. First, the 20-day volume peak occurred not at the price trough but in the December 2024 industry-PBM leg (the 20-day window ending 23 December 2024) — the most crowded selling was the sector-political episode, not a Cigna-specific panic. Second, the single most violent day, 30 October 2025, traded 9.3 million shares — about 7.4x the pre-peak median — but that spike did not sustain into a multi-week washout. The pattern reads as repeated bouts of anxious-to-orderly repricing rather than one exhaustive capitulation.
Who was selling
The evidence on seller composition is thin, and where it is absent the tab says so rather than infer. Reported short interest is unavailable for CI in this corpus — the short-interest feed returned no position rows, so short-interest level, change, and days-to-cover cannot be quantified here. No forced or structural sellers are disclosed in the filings: no index deletion, no fund-liquidation event, no cluster of insider sales tied to the drawdown surfaced in the corpus.
What the data does support is that this was a liquid, orderly market throughout. The stock trades roughly $463 million a day (20-day average), zero zero-volume days over the last 60 sessions, with a small median daily range near 0.9% — a large-cap where a seller could exit without moving the tape. The character of the selling is therefore best described by the volume gauge above (moderate, sector-led) and by the fact that the largest leg was a whole-industry political repricing that hit every PBM owner at once — anchored and macro-driven selling more than informed, name-specific exit — but the direct seller-identity evidence (short interest, 13F flow) needed to say so with confidence is not in this corpus.
Estimates versus price — the timing
This is where Cigna departs from the classic dislocation. In the framework's canonical case the earnings estimate is cut and the stock falls with it. Here the estimate did not fall. Cigna established its 2025 outlook at "at least $29.50" in January 2025 [8], raised it to "at least $29.60" and reaffirmed that figure at every quarter of the drawdown [9], then set a 2026 outlook of at least $30.35, reiterated in January 2026 [10]. Guidance rose across the fall.
Source: sell-side consensus, current snapshot (data/sp/estimates.json, eps_normalized mean); point-in-time revision history is not in the corpus.
Consensus forward EPS in the current snapshot rises every year — $29.65 for 2025 to $41.92 for 2029 — and consensus forward free cash flow (per fit_features.consensus_forward_yield) runs $9.0 billion in 2026 rising to $10.2 billion in 2027, yields of 11.8% and 13.3% on the current $76.5 billion market cap. Against a price down 33.4%, the earnings line the sell side underwrites did not fall one-for-one; the multiple did most of the work. The timing caveat is a genuine data gap: this run holds only the current estimate snapshot, not the dated CapIQ revision series, so the exact date-by-date path of consensus cannot be plotted — the claim rests on the guidance progression, which is dated and cited, and on the direction of the current forward curve.
The framework's signature — a price fall that outruns the change in the earnings estimate — is therefore present, and unusually stark: the price fell 33% while the guided and consensus earnings numbers moved higher. Whether that gap is a mispricing or a fair discount for a lower-quality two-year PBM trajectory is not this tab's question — that is the work of the Damage Math and Yield tabs. What happened is clear: a moderate, multi-leg de-rating on real but datable triggers, with the earnings estimate intact.
Damage Math
Cigna's price fell about a third from its September-2024 peak, yet consensus adjusted EPS never fell — it grew, $27.33 in FY2024 [1] to $29.84 in FY2025 [2] toward $30.41 for FY2026E. The trigger was a stop-loss mispricing worth roughly 100 bps of one segment's margin. Under conservative assumptions the problem destroys $0.7–9B of net present value against $27–38B of erased market value. The independent trial puts the probability the impairment is temporary at 0.62.
The near-term hit: consensus earnings barely moved
The pattern Ruchir's framework hunts is a company where near-term earnings were cut and the stock was anchored to the cut. Centene is the archetype — a roughly two-thirds guidance cut and a roughly two-thirds price fall. Cigna is a weaker version of that setup on the earnings axis, because the near-term earnings line did not break.
Adjusted EPS grew straight through the drawdown. FY2023 landed at $25.09 [3], FY2024 at $27.33 — up 9% but, in management's own words, "short of our outlook" [4] — and FY2025 at $29.84, up another 9.2% [5]. The one visible dent was a single quarter: Q4 2024 normalized EPS of $6.64 against a $7.82 consensus, a −15.1% miss of about $1.18 per share, the only normalized-EPS miss in the last sixteen quarters (per S&P Capital IQ consensus). The full-year number kept rising.
Actuals: Q4 2023–Q4 2025 earnings calls [6][7][8]. FY2026E–FY2029E: consensus, S&P Capital IQ (data/sp/estimates.json).
What did fall was the growth rate, for one year. Management guided FY2025 to "at least $29.50 per share" at the Q4 2024 call [9] — a step down from the company's stated 10–13% long-term algorithm — then set FY2026 at "at least $30.25 per share" [10], later raised to "at least $30.35" after Q1 2026 [11]. At $30.41, FY2026 consensus is only about 1.9% above FY2025 — the single year of below-algorithm growth. FY2027 consensus of $33.48 resumes roughly 10% growth. On the vendor record, the out-year lines have barely moved: over the trailing six months FY2027 normalized EPS went from $33.51 to $33.48 and FY2028 from $37.00 to $37.01 — flat, within a percent (S&P Capital IQ point-in-time consensus). The consensus tape shows a one-year pause, not a permanent reset.
That is the numerator of this tab, and it is small: a one-quarter miss of about $1.18 per share, plus one year of growth running roughly 8–9 points below the algorithm before it re-accelerates on consensus. The Dislocation tab covers what the price did over the same window.
The price and enterprise value: a third of the equity, gone and partly back
Against that near-flat earnings line, the equity moved a great deal. The stock peaked at $366.85 on 16 September 2024, troughed at $244.41 on 31 October 2025 — a 33.4% decline over 410 days — and sits at $284.85 as of 22 July 2026 (derived: fit_features.capitulation_gauge). Translated to market capitalization on the share counts of the day, that is roughly $104B at the peak, about $66B at the trough, and $76.5B now (derived: fit_features.market_cap; share counts from fit_features.share_count_trend).
Prices: fit_features.capitulation_gauge (data/prices/daily.json); market cap = price × shares outstanding of the period (fit_features.share_count_trend, market_cap).
The equity lost about $38B from peak to trough (−36%, slightly more than the −33.4% price move because the share count also fell as buybacks continued), and it sits roughly $27.5B below the peak today (−26%). Enterprise value moved almost entirely with the equity: net debt is a stable-to-declining ~$24B (consensus net debt $23.9B for FY2025, guided down toward $18.7B for FY2026E, per S&P Capital IQ), so EV fell by essentially the same $27–38B as the market cap, from roughly $130B toward $100B. Debt is not the story here; the equity is.
Put the two sides together and the mismatch is the whole point of this tab: consensus FY2026 adjusted EPS rose about 2% while the market cap fell about 26% from the peak. Almost none of the price move is an earnings move.
The move was a multiple, not an earnings collapse
Holding forward earnings fixed at today's FY2026 consensus of $30.41 isolates what actually changed — the multiple the market was willing to pay.
Derived: peak/trough/current price ÷ FY2026 consensus adjusted EPS of $30.41 (data/sp/estimates.json; prices from fit_features.capitulation_gauge). Forward EPS at the peak was itself near $30, so the ratio characterizes a multiple move.
The price traveled from about 12.1x at the peak to 8.0x at the trough to 9.4x now, on a forward EPS number that has been near $30 throughout. A useful cross-check runs the multiple backward into an implied terminal-growth rate: at the current $76.5B market cap, on ~$8.0B of normalized after-tax earnings (FY2025 net income normalized, data/sp/estimates.json) and a 9% discount rate, the price implies adjusted earnings shrinking about 1.3% a year in perpetuity. At the peak market cap of ~$104B, the same arithmetic implied earnings growing about 1.2% a year. The de-rating swung the market's implied perpetual-growth assumption by roughly 2.5 points — from mild growth to mild permanent decline — on a business whose revenue grew 11% in FY2025 and whose adjusted EPS grew 9%.
The NPV arithmetic: how much value could the problem plausibly destroy
The question is whether a hit this size can justify $27–38B of lost value. A transparent two-scenario DCF-lite answers it. The assumptions are deliberately simple and stated so a reader can reproduce every number.
Cigna Healthcare booked $47.16B of adjusted revenue and $4.15B of adjusted operating income in FY2025 [12]; 100 bps of margin on that revenue base is about $0.47B pre-tax. Evernorth's Q1 2026 Pharmacy Benefit Services pre-tax income fell from $544M to $394M — about −28% — which annualizes to roughly $0.6B of pre-tax income [13]. Those are the two hit sizes; the rest is discounting.
Derived: NPV = after-tax hit discounted at 9%. Temporary = two years discounted then recovery; permanent = level-shift perpetuity (after-tax hit ÷ 0.09). Hit sizes from FY2025 10-K segment revenue [14] and Q1 2026 10-Q [15].
The temporary reading destroys about $0.65B of value — under 1% of the market cap. The permanent reading, treating the PBM compression as a level-shift that never reverses, destroys about $5.3B; pushed to a severe $1.0B-a-year permanent hit, about $8.8B, or roughly 12% of the market cap. Set those against the price damage and the gap is the finding of the tab.
Derived: price damage from market-cap change (fit_features.market_cap, capitulation_gauge); NPV damage from the two-scenario DCF-lite above.
Even the severe permanent case destroys about $8.8B of NPV against roughly $27.5B of market value erased from the peak — a gap of about $19B, some 70% of the price damage. On the temporary reading the gap is roughly $27B. The price fell substantially more than any defensible reading of the value.
The gap is real and large. It is not, on its own, a verdict — a gap only becomes an opportunity if the impairment is in fact temporary, and that question is not settled by this arithmetic. It is settled, as fairly as the profile can, by an adversarial trial.
The trial: temporary versus permanent, both cases at full strength
Two opposing briefs argued the diagnosis from the same corpus; three blind judges ruled. Both cases have genuine evidence, and neither is a straw man.
Three independent judges, reading the briefs in randomized order, put the probability the impairment is temporary at 0.62 (mean of the panel 0.63; individual judges 0.59, 0.62, and 0.69; spread 0.10). Order stability was tight — the two reading orders differed by 0.02 — and the ruling was not flagged as contested (ruchir/trial/tally.json). This is the diagnosis probability the report carries; the arithmetic above cannot override it, and does not try to. The reading leans temporary, but with roughly a 38% weight on the permanent case that the PBM margin trend is genuinely re-basing lower — a weight the Durability tab tests on the 8–20 year horizon.
The panel also fixed what would flip the ruling toward permanent: FY2026 Cigna Healthcare MCR printing above 84.7% or adjusted EPS below $30.25 (repricing failed to stick); Evernorth or Pharmacy Benefit Services pre-tax income declining year-over-year beyond disclosed transition costs; PBM profit per claim staying below the 2025 base after rebate remittance and Part D delinking take full effect post-2028; or medical customers falling materially below ~18M beyond the deliberate exchange exit.
Which line broke, and whether it self-corrects
Two distinct drivers sit behind the hit, and they carry different recovery mechanisms.
Stop-loss (Cigna Healthcare) — mechanical repricing. Stop-loss is a one-year product priced annually; the 2024 cost spike was locked into 2025 pricing before it was visible, then addressed at the next renewal. Management's ~100 bps recapture is scheduled across 2026–2027 on that renewal cadence [30], and the FY2026 MCR guide of 83.7–84.7% already incorporates the pricing actions [31]. This is the piece that self-corrects, and it is the majority of the near-term earnings dent.
Evernorth / Pharmacy Benefit Services — the contested driver. Here the recovery mechanism is genuinely in question. Management frames the Signature transition as margin-neutral with 97%+ retention [32], but the segment's margin has fallen from 5.3% to 3.1% since 2019 [33], Q1 2026 PBS income fell 28% on higher revenue [34], and the 2028 rebate-remittance and Part D delinking rules are structural, not cyclical [35]. If this driver re-bases permanently, it is the permanent-case scenario in the DCF-lite above — worth roughly $5–9B of NPV, still well short of the price damage, but a genuine and structural reduction rather than a calendar artifact. The Durability tab carries the long-horizon read on this line, and the framework's adjusted-FCF yield — which strips stock compensation and average acquisition spend from the cash the buyback flywheel runs on — is built in Yield.
The bottom line of the arithmetic: the price destroyed on the order of $27–38B of market value; the problem, read conservatively and even at its permanent worst, plausibly destroys $0.7–9B of net present value. A gap of roughly $19–27B separates the two. Whether that gap is an opportunity turns on the diagnosis — and the trial puts the probability it is temporary at 0.62, not a certainty.
Yield
On the framework's adjusted basis — reported free cash flow minus stock compensation minus a five-year average of acquisition spend — Cigna converts to roughly $7.5 billion of adjusted FCF on FY2025 filings, a 9.8% yield on the $76.5 billion market cap: 20 basis points short of the 10% default bar, but above it on the three-year average (10.9%) and on consensus forward FCF (11–13%). The balance sheet is moderate (net debt near 1.9x EBITDA), so the 10% line — not the fortress or levered line — applies. The adjustment removes little: Cigna is a cash generator trading near its own long-run ~10% yield, not a reported figure inflated by roll-up accounting.
The adjustment, line by line
The framework does not take reported free cash flow at face value. It removes two recurring drains a cash-flow statement understates: stock-based compensation (a real cost paid in shares, not always added back as its own line) and the ongoing capital a serial acquirer spends to stand still, smoothed as a five-year average. For Cigna the arithmetic starts from operating cash flow less property-and-equipment purchases, both taken straight from the filed statements.
Adjusted FCF = reported FCF (operating cash flow − property & equipment purchases) − same-year SBC − trailing five-year-average acquisitions; all figures $M, derived from company filings. Operating cash flow, capex and acquisitions: FY2025 10-K [1], FY2023 10-K [2], FY2021 10-K [3]; SBC from Note 18 (Employee Incentive Plans): FY2025 [4], FY2023 [5], FY2021 [6].
The FY2025 line reads: operating cash flow of $9,601M less $1,212M of capex is reported FCF of $8,389M [7]; subtract $291M of share-based compensation [8] and a five-year acquisition average of $602M (FY2021–FY2025 acquisitions of $1,833M, $0, $447M, $131M and $597M, divided by five) [9] and adjusted FCF is $7,496M.
What the adjustment does not do here is material to the read. The two deductions together take about $0.9 billion off an $8.4 billion reported figure — roughly an 11% haircut. SBC runs a steady $264–308M a year, small for a company this size [10]; recurring acquisition spend since 2019 has averaged about $600M, dominated by one 2021 bolt-on (the $1,833M MDLIVE-era outlay) rather than a continuous roll-up [11]. This is not a company whose reported cash flow is flattered by serial dealmaking. The one transformational deal — the ~$52 billion Express Scripts acquisition — closed in December 2018, before every window shown here; including it would swamp the average and misstate Cigna's recurring M&A intensity, so the five-year windows deliberately start in 2019.
The deterministic feature file returns adjusted FCF as not computable — the structured data feed carried no SBC, capex or acquisition values for FY2020 onward and only free cash flow through FY2019. The table above is reconstructed directly from the filed cash-flow statements and the employee-incentive notes, which do carry every line. Where this tab cites an adjusted figure, it is this reconstruction, not the feature pipeline's output.
The yield, three ways
Current adjusted yield (FY2025)
3-year average yield
7-year baseline (median)
Adjusted FCF ÷ market cap of $76.5B (268.563M shares at $284.85, 22 Jul 2026). Current = FY2025 adjusted FCF $7,496M; 3-year average = FY2023–FY2025 mean adjusted FCF $8,358M; baseline = median of per-year adjusted-FCF yields FY2019–FY2025. Derived from company filings; market cap per the price feed.
The three cuts frame the range. On trailing FY2025 adjusted FCF, the yield is 9.80% ($7,496M ÷ $76,500M). On the three-year average adjusted FCF of $8,358M — smoothing a working-capital-boosted 2023 and a cyclically pressured 2025 — it is 10.93%. And the company's own seven-year distribution of adjusted-FCF yields (each year's adjusted FCF over that year's market cap) carries a median near 10.3%.
Per-year adjusted FCF ÷ same-year market cap (year-end shares × year-end close); FY2019–FY2022 adjusted FCF uses a partial acquisition window (2019 onward) and is approximate. Derived from company filings and the price feed. Cash-flow components: FY2025 [12], FY2021 [13].
The distribution matters because the fortress signature the framework looks for is a jump — a name that sat at a stable 3.5–4% for years and is suddenly offered near 8–9% because the price collapsed while the cash flow held. Cigna does not show that shape. Its adjusted-FCF yield has orbited 10% for most of a decade: near 10–11% in 2019–2020, dipping to ~6.3–6.5% in 2021–2022 when the stock ran to $331 (year-end 2022) even as FCF softened, then back to ~10–10.6% across 2023–2025. The current 9.80% sits just below the seven-year median, not two times above a lower baseline. What the drawdown has done — a 33% fall from the September 2024 peak of $366.85 to the October 2025 trough of $244.41, detailed in the drawdown anatomy (Dislocation) — is move the yield from roughly 7% at the peak ($7.5B on a ~$104B peak market cap) back up toward its own 10% norm. That is a return to baseline, not a dislocation spike above it. The honest read: Cigna clears the bar the way it usually does, not because fear has repriced a fortress.
Which bar applies
The reference line is set by the balance sheet, so it has to be computed before the yield can be judged against it. The framework's rule: net debt at or below zero (or under 0.5x EBITDA) is a fortress, which lowers the bar to ~8–9%; 3.0x or above is levered, raising it to 25%; anything between is moderate, and the 10% default holds.
Cigna FY2025 Consolidated Balance Sheets [14].
Total debt is $31,463M (short-term $592M plus long-term $30,871M) [15]. Against cash and equivalents of $7,676M plus short-term investments of $1,056M, net debt is $22.7 billion (or $23.8 billion counting cash alone). EBITDA on FY2025 filings is about $12.0 billion — operating income of $9,200M plus $2,775M of depreciation and amortization [16] — and consensus puts actual FY2025 EBITDA at $12,351M. Either way, net debt to EBITDA computes to roughly 1.8–1.9x ($22,731M ÷ $12,351M = 1.84x). That is squarely moderate: above the 0.5x fortress threshold, well below the 3.0x levered line. The 10% default bar applies.
The feature file records this class as unknown because the structured feed carried no FY2025 debt figure; the filed balance sheet does, and it places Cigna in the moderate band.
Stated plainly against that line: 9.80% on FY2025 adjusted FCF against the 10% bar — 20 basis points short. On the three-year average the same company sits 93 basis points over it (10.93%). Cigna straddles the reference line rather than clearing or missing it decisively.
Normalized mid-cycle yield
Managed care is mildly cyclical, not deeply so — there is a medical-cost and underwriting cycle, but no commodity-style swing that leaves a single year unrepresentative. Two things nonetheless make raw FY2025 an imperfect anchor. First, FY2023 adjusted FCF of $9.4 billion was lifted by unusually favorable working capital — pharmacy and other service costs payable rose $2,030M and accounts-payable/accrued liabilities $3,481M that year [17]. Second, FY2024–FY2025 fell inside the industry's elevated-medical-cost stretch, which compressed margins and, with a $597M acquisition year in 2025, pulled adjusted FCF down to $7.5 billion.
The mid-cycle estimate centers those two: the three-year average adjusted FCF of $8,358M ($9,440M, $8,139M and $7,496M ÷ 3), which nets the working-capital high against the cyclical low. On the current $76.5B market cap that is a mid-cycle adjusted yield of ~10.9%. The assumptions are explicit enough to recompute under an alternate window: narrow to the two elevated-cost years FY2024–FY2025 and mid-cycle adjusted FCF falls to ~$7,818M (a 10.2% yield); widen to include consensus FY2026 FCF (net of the ~$0.9B adjustment, ~$8.1B) and it rises. Across every reasonable window the mid-cycle yield lands between about 10.2% and 11%, i.e. at or modestly above the 10% bar. A skeptic who prefers the single depressed FY2025 figure gets 9.8%; one who normalizes gets ~10.9%.
The consensus check
The sell side does not need Cigna's cash flow to recover to clear the bar — it already models it above. On CapIQ estimates dated 22 July 2026, consensus free cash flow (the vendor's free cash flow line, the closest direct proxy to the framework's numerator) runs $9.5B in FY2025 rising to $10.3B by FY2028 — yields of 12.4% to 13.4% on today's market cap.
Consensus estimates (CapIQ), generated 22 Jul 2026; vendor free-cash-flow line and cash-from-operations less capex, mean estimates. As reported in the estimates feed.
Two proxies bracket the answer, and naming which is which matters. The vendor's headline free-cash-flow metric ($9.5B FY2025, a 12.4% yield) sits well above the 10% bar. A plainer construction — consensus cash from operations less capex ($8,238M − $1,300M = $6,938M in FY2025) — yields only 9.1%, just under it, because the vendor's FCF line runs richer than a simple operating-cash-flow-minus-capex build. The gap narrows in the out-years as consensus CFO estimates rise: by FY2027 the CFO-less-capex proxy reaches $9,049M (11.8%) and the vendor line $10,162M (13.3%).
Apply the framework's own ~$0.9 billion adjustment (SBC plus five-year-average acquisitions) to the vendor forward line and the adjusted forward yield is still ~10.6% in FY2026 rising to ~12% by FY2027 — above the bar on the richer proxy, right at it on the conservative one. The setup this describes is fear rather than a fundamentals problem: analysts model FCF that clears or nearly clears the 10% line every forward year, they carry a mean price target of $340.92 against the $284.85 quote (24 analysts, 20 buy/outperform ratings to four holds and no sells), and consensus net debt falls from $23.9B in FY2025 toward $16.0B by FY2027 — deleveraging that would only strengthen the balance-sheet class. Because consensus already sits at or above the bar, no mean-reversion underwrite is required; the risk is not that Cigna must climb back to the line but that the softer CFO-less-capex proxy, if it proves the truer FCF, leaves the current-year yield a point below it.
FCF-to-revenue conversion
The one genuinely deteriorating series in this tab is cash conversion. Reported FCF as a share of revenue has fallen from ~5.5% in 2019–2020 to ~3.0% in 2025.
Reported FCF (operating cash flow − capex) ÷ total revenue. Revenue per the financial feed; cash-flow components from the filed statements [18].
The decline is real but mostly a mix artifact. Revenue rose from $153.6B in 2019 to $274.9B in 2025, the bulk of the growth coming from Evernorth's pharmacy and PBM activity, where drug-cost pass-through inflates the top line at near-zero margin — so the denominator grows faster than any cash-generative business underneath it. The counter-fact that keeps this honest: the numerator has also drifted down in absolute terms, from $10.2B reported (2023) to $8.4B (2025), and adjusted FCF from $9.4B to $7.5B. Some of that is the working-capital and medical-cost story above rather than structural erosion, but the trend does not support treating Cigna as an accelerating cash compounder; it is a large, steady generator whose per-dollar-of-revenue conversion is being diluted by low-margin volume. That distinction — dilution by mix versus decay in the underlying — is what the durability of the cash flows (Durability) turns on.
Durability — the year-10 question
Cigna's revenue rose every year from $39.8 billion in 2016 to $274.9 billion in 2025, so the three-consecutive-year-decline disqualifier is absent. Conviction that year-10 revenue is higher rests on a stable pharmacy-benefit oligopoly, insurance and PBM licensing barriers, and an essential product. The genuine doubt sits on the free-cash-flow leg: federal and state law is now migrating the rebate-and-spread economics of the pharmacy-benefit business — Cigna's largest profit engine — onto a transparent fee basis by 2028–29.
Where the conviction comes from
Each source below is graded for Cigna specifically. Two apply strongly, one applies with a caveat, one does not apply at all.
Market structure: a stable pharmacy-benefit oligopoly
Cigna is two businesses. Evernorth Health Services — the Express Scripts pharmacy-benefit manager plus the Accredo specialty pharmacy and care-services units — now contributes more than 60% of enterprise earnings [1]. Cigna Healthcare, the medical-insurance segment, is the smaller engine. The Business tab describes both; the durability point is the structure each sits inside.
The pharmacy-benefit market is a three-firm oligopoly. Express Scripts processed 2.2 billion adjusted scripts in 2025 and manages pharmacy benefits for more than 100 million Americans, saving clients roughly $38 billion a year [2]. Its two rivals are the pharmacy arms of larger insurers: CVS Health's Caremark and UnitedHealth's OptumRx, the latter managing $188 billion of drug spend in 2025 [3]. CVS's own 10-K names its principal PBM competitors as "the Express Scripts business of Cigna Corporation and the Optum Rx business of UnitedHealth Group" [4] — the three name each other and no one else at scale. Independent industry trackers put the three at roughly 80% of U.S. prescription-claim volume, a share that has been remarkably stable, with Express Scripts the volume leader in 2025 for a second consecutive year. Cigna's own filing lists its competitors only as generic categories — "independent and managed care pharmacy benefit managers; retail, home delivery and specialty pharmacies" — and does not quantify the concentration [5].
Source: FY2025 10-K, Segment Reporting — Evernorth adjusted revenues [6]; Cigna Healthcare adjusted revenues [7].
On the insurance side, the medical book has held in a narrow band — 17.1 million members in 2021, 19.8 million in 2023, 18.1 million in 2025 — with the 2025 step-down driven by the sale of the Medicare Advantage business, not by losing commercial share [8]. Across the enterprise Cigna touches more than 185 million customer relationships in over 30 markets [9].
Source: FY2025 10-K medical-customer table [10]; FY2021 10-K for FY2019–FY2021 [11].
Grade: applies strongly. Both businesses sit in concentrated markets with stable positions and no fringe of small entrants taking share.
Regulatory entry barriers: licensed, capitalized, approved
A new competitor cannot assemble Cigna's position in a garage. Every insurance company and HMO subsidiary must be licensed in each jurisdiction it operates in [12]. Insurers must hold risk-based capital above statutory minimums or face regulatory action "ranging from increased scrutiny to conservatorship," and any acquisition of control of an insurer or HMO needs regulatory approval [13]. The PBM itself is separately regulated — rebate disclosure and retention, spread pricing, and PBM registration and licensing are all governed by "numerous laws and regulations" [14].
Grade: applies strongly — but this is the double-edged source. The same regulatory apparatus that keeps entrants out also holds the lever that can rewrite Cigna's PBM economics. That reversal risk is hunted below.
Capital intensity is not the moat here
Ruchir's framework credits capital-heavy essentials — the replacement cost of a rail network or a utility base is itself a barrier. That source does not apply to Cigna. This is an asset-light services and underwriting business: capital expenditure has run near $1 billion a year, under half a percent of revenue. The moat is scale, formulary and network access, regulatory licensing, and switching friction — not a physical asset base that would be ruinous to replicate. Nothing in the year-10 case should lean on capital intensity.
Source: capital expenditure derived from reported cash-flow statements, as filed.
Essentialness: real, but the commercial book is employment-linked
Prescription drugs and medical coverage are non-discretionary, and Cigna sits in the middle of the flows for both. That is genuine essentialness. The caveat is honest: roughly half of the medical book is employer-sponsored, and the filing itself frames economic downturns as a risk — unfavorable conditions "on our clients and customers (both employers and individuals)" can shrink the customer base and revenues [15]. Drug volumes are recession-resistant; commercial enrollment tracks employment. The revenue record supports the resilient read — Cigna grew through the 2020 pandemic year and every year since — but the segment is not fully cycle-proof.
Grade: applies, with the employment-linkage caveat.
Operating history: forty-four years public, seven in the current shape
Cigna's predecessor was incorporated in Delaware in 1981 [16] — a public company through four decades and multiple downturns. The important qualifier for durability is that the current configuration is young: the company only became a PBM-led enterprise when it combined with Express Scripts on December 20, 2018 [17]. The businesses inside it are old; the shape that generates 60% of earnings today has about seven years of operating history under one roof.
Grade: applies moderately — long corporate life, short life in its present form.
The structural threats
Execution is not a moat, so the durability case is tested against structural forces, not against how well management runs the book.
The regulatory reversal: PBM rebate-and-spread reform
This is the real threat, and it is no longer hypothetical. Federal law now dismantles the traditional pharmacy-benefit revenue model in two steps. Beginning January 2028, PBMs are prohibited from receiving Medicare Part D compensation "directly or indirectly linked to the list price" of a drug — compensation is limited to bona-fide service fees; and beginning August 2028, PBMs must "remit 100% of certain rebates, fees and other remuneration to plan sponsors" [18]. Cigna's own risk factors concede that reforms "related to rebates, reporting, owned pharmacies and other activities may adversely affect our ability to price our pharmacy products and services appropriately" [19]. More than 1,250 PBM and drug-benefit bills were introduced across the states in 2025, several enacting spread-pricing bans, delinking, and — in Arkansas — an outright ban on PBM-owned pharmacies now in litigation. The Federal Trade Commission also filed an administrative complaint against Express Scripts and two other PBMs in September 2024 over insulin rebate practices; that matter settled in February 2026 with "no monetary penalty, finding of fault or admission of liability" [20].
This is the "your margin is my opportunity" test pointed at Cigna: the state is trying to make the rebate-and-spread margin obsolete by statute. The year-10 magnitude is what matters, so size it.
Source: FY2025 10-K — Evernorth segment detail [21]; Cigna Healthcare segment detail [22].
The traditional-PBM unit most exposed to rebate-and-spread reform — Pharmacy Benefit Services — earned $3.5 billion of pre-tax adjusted income in 2025, about 31% of the $11.4 billion its two operating segments earned before tax [23]. Reform hits a slice of that slice: sell-side analysis estimates retained rebates at under a tenth of Evernorth's adjusted pre-tax earnings, and the mandates phase in only in 2028–29. Cigna is also pre-empting the rule rather than defending the old model — in late 2025 it committed to "a customer-first, no rebate, no spread, fully transparent, fee-based model," with the entire Cigna Healthcare fully-insured book adopting it in 2027 and at least half of Evernorth by year-end 2028 [24]. The honest read: this is a real, permanent compression of how the PBM captures value — a margin-model migration, not a share loss — plausibly a low-to-mid single-digit percentage headwind to Evernorth profit at full phase-in, and a genuine source of uncertainty about the shape of PBM profitability in year 10. The larger tail is escalation: a federal PBM-owned-pharmacy divestiture mandate, of which the state bans are precursors, would be materially worse, but no such federal law exists today.
Substitution and technology: who is hunting the margin
The disruptor threat was searched directly, and on the evidence it is real on price but marginal on volume. Amazon Pharmacy and Mark Cuban's Cost Plus Drugs are cash-pay and direct-to-consumer models; online pharmacy is a low-single-digit-billions niche of a roughly $300 billion retail-pharmacy market, and no independent claim-volume data shows them taking material share from the big three through 2025. Where the pressure is real is the pricing model — transparent, pass-through, cost-plus contracting — and here the incumbents have co-opted the disruptors' idea. Cigna was, on its own account, "the first to launch a scaled pharmacy network model offering cost-based pricing" with Express Scripts ClearNetwork [25]. GLP-1 drugs — forecast to reach nearly 10% of the U.S. population within a decade and already the number-one pharmacy trend driver — are a revenue tailwind for the PBM, not a substitution threat, because Cigna is the party positioned to manage that spend down [26]. Substitution risk to year-10 volume is low; the substitution of the pricing model is the same force already counted under regulatory reform.
The medical-cost-trend pressure
The insurance segment's medical care ratio rose from 81.3% in 2023 to 84.4% in 2025 — more of each premium dollar paid out in claims [27]. This is the industry-wide cost-trend problem, and it is the near-term earnings pressure the Dislocation and Damage Math tabs weigh as temporary-or-permanent. For durability the relevant point is narrower: elevated cost trend is a cyclical margin pressure that reprices through premiums, not a structural erosion of the franchise — but it does pressure the free-cash-flow leg while it runs.
Customer concentration
Evernorth's revenue leans on a few very large clients — Centene, the Department of Defense, and Prime Therapeutics — one of which, Centene, is also a managed-care competitor whose PBM agreement only began on January 1, 2024 [28]. Concentration is a genuine sensitivity, mitigated by contract tenure: PBM client retention is running near 97% for the 2026 season, and the three largest clients are secured "through the end of the decade" [29], a point the FY2025 10-K restates [30]. The lock-ins protect revenue into the late 2020s but not to year 10.
The disqualifier check
The framework's mechanical disqualifier is revenue declining high-single-digit for three consecutive fiscal years after a long existence. fit_features.revenue_trajectory records consecutive_decline_years: 0 and three_year_hsd_decline: false. The history shows why.
Source: company filings, as reported; FY2025 total and segment revenues from the FY2025 10-K [31]. Figures match fit_features.revenue_trajectory.
Revenue has increased in all nine year-over-year steps. The two large jumps are acquisitions and a mega-contract, not organic surges: the 2019 step is the first full year of Express Scripts, and the 2024 step (+27%) is Pharmacy Benefit Services revenue rising 46% as the Centene contract went live [32], [33]. Even the 2025 Medicare Advantage divestiture to HCSC for $4.9 billion — which removed a whole revenue line — did not produce a decline, because pharmacy volume more than absorbed it [34].
X3 — structural decline: checked and absent. The disqualifier flag is false, and no episode of even a single-year revenue decline appears in the ten-year record.
The year-10 question, both ways
The gate is binary by construction: year-10 revenue AND year-10 adjusted free cash flow must both be higher than today, held with very high conviction. The two legs do not carry equal conviction.
The strongest case that both are higher. Revenue is the easier leg. U.S. drug and medical spending grows structurally; Cigna sits in a three-firm PBM oligopoly with the leading script volume, an insurance book stable near 18 million members, 185 million customer relationships, and anchor clients locked through the end of the decade [35], [36]. Entry is barred by licensing, capital, and approval requirements [37], [38]. GLP-1 volume adds to the PBM's pool rather than bypassing it [39]. Management's five-year plan targets 10–14% adjusted EPS growth against a 13% ten-year track record and about $60 billion of cumulative operating cash flow [40], and sell-side consensus carries free cash flow near $9–10 billion a year through 2029 (see Yield). Ten-year revenue higher is a very-high-conviction claim.
The strongest doubt. It sits entirely on the free-cash-flow leg, and it is structural, not cyclical. The rebate-and-spread economics that underpin roughly a third of Cigna's operating income are being legislated onto a fee basis — delinking and 100% rebate pass-through by 2028–29 [41], with the states pressing further and vertical-integration bans an escalation risk. The company's own filing says these reforms "may adversely affect our ability to price our pharmacy products and services appropriately" [42]. None of the durability comfort here can come from Cigna out-executing the transition, because execution is not a moat; the question is whether the fee-based PBM of 2035 earns as much as the rebate-based PBM of 2025.
The read, once. The gate holds — year-10 revenue and adjusted free cash flow are more likely than not higher — but it holds at high conviction, not the maximal setting the framework prizes. Revenue clears with very high conviction; free cash flow clears with a genuine, named, and quantified doubt attached — PBM rebate-and-spread reform, hitting a ~31%-of-income unit whose retained-rebate profit is under a tenth of Evernorth's pre-tax earnings, phased to 2028–29, and being pre-empted by Cigna's own move to a transparent fee model [43]. On the evidence the doubt reads as contained rather than existential, so this is a gate that holds with a caveat rather than one that fails — but a strict reading of "very high conviction on both legs" is where the reform doubt keeps this short of unqualified.
Free-cash-flow consistency
fit_features.fcf_stability is not_computable: the deterministic rolling-five-year adjusted-FCF series is empty because stock-based-compensation inputs are missing for FY2016–FY2019 and no complete five-year adjusted-FCF window exists, so the coefficient of variation cannot be formed. That gap is recorded, and the adjusted-yield computation itself lives in the Yield tab. The underlying cash record can still be read for consistency, and it reads as stable, not unpredictable.
Source: Consolidated Statements of Cash Flows, FY2016–FY2025, as filed; FY2025 figure from the FY2025 10-K [44].
Operating cash flow has been positive every year for a decade, stepping up to a $7–12 billion band after the Express Scripts combination and staying inside it through 2025. There are no negative episodes in the record. That is a meaningful distinction under the framework: Cigna is a managed-care and pharmacy-services business, not a property or long-tail underwriter, so it does not carry the 5–8-year underwriting-loss cadence that makes an occasional negative FCF year healthy for a bank or a property-casualty insurer. Its consistency comes from the absence of that cycle, not from surviving it. Year-to-year cash flow is volatile — swinging with medical-cost timing, working capital, and rebate flows — but it is not unpredictable in the sense the framework worries about, and forward consensus holds it near $9–10 billion annually through 2029.
P2 — consistency: the specific adjusted-FCF stability metric is not computable and is flagged as a data gap, but the available ten-year operating-cash-flow record shows a stable, always-positive series with no business-model-inherent negative cadence — consistent on the evidence that exists.
Self-Help
The balance sheet clears the framework's outlast test: moderate leverage of roughly 1.9x net debt to EBITDA, a 43.0% debt-to-capitalization ratio against a 60% covenant ceiling, and near-term maturities that are trivial beside roughly $8.4 billion of annual free cash flow and about $13 billion of undrawn facilities. The repurchase engine is real and executed, not merely authorized — the share count is down about 29% from its 2019 peak. Management's promise-versus-delivery record is reliable, with one admitted 2024 miss.
The balance sheet against the problem's duration
At December 31, 2025, Cigna carried $592 million of short-term debt and $30,871 million of long-term debt — about $31.5 billion in total [1]. Against that sits $7.9 billion of cash and short-term investments, an undrawn $6.5 billion revolving credit facility maturing April 2030, and $6.5 billion of unused commercial-paper capacity [2].
Total Debt ($M)
Debt / Capitalization
Net Debt / EBITDA (x)
EBIT / Interest (x)
Sources: total and net debt from the FY2025 10-K Note 7 – Debt [3] and Consolidated Balance Sheets; debt-to-capitalization as reported [4]; Net Debt/EBITDA and interest coverage derived from reported operating income ($9,200M), depreciation and amortization ($2,775M) and interest expense ($1.4B).
The framework scales its yield bar to the balance sheet, so the class matters. The deterministic feature file leaves balance_sheet_class not_computable because the structured feed is missing a clean FY2025 debt-and-cash pair, so the class is derived here from the filing. Net debt of about $22.7 billion (total debt of $31.5 billion less $8.7 billion of cash and short-term investments) against EBITDA of roughly $12.0 billion (operating income of $9,200 million plus $2,775 million of depreciation and amortization) is about 1.9x [5]. That sits inside the framework's "moderate" band, which sets the reference line for the adjusted-yield test at 10% (the arithmetic of that yield lives in Yield).
Leverage headroom is not the binding constraint. The reported debt-to-capitalization ratio was 43.0% at year-end 2025 (43.8% a year earlier), against the revolving-credit covenant that the leverage ratio may not exceed 60%; the company was in compliance with its debt covenants as of December 31, 2025 [6]. Interest expense held at $1.4 billion in 2025, covered about 6.6 times by operating income [7].
The maturity wall, year by year
Source: FY2025 10-K, Note 7 – Debt, Debt Maturities table (includes current maturities of long-term debt; finance leases excluded) [8].
The schedule is back-loaded and undemanding at the front. Only $550 million comes due in 2026 and $2,359 million in 2027 — sums smaller than a single year's free cash flow. The heavier steps ($3.8 billion in 2028, $2.4 billion in 2030) and the $21.5 billion beyond 2030 are spread over decades, with a laddered book of fixed-rate senior notes reaching to 2056 [9].
Refinancing risk at current rates is present but bounded. Cigna's September 2025 issuance of $4.5 billion priced at coupons of 4.500% to 6.000%, above the sub-3% notes it is gradually replacing, so refinanced debt reprices upward — but the near-dated maturities are small enough that this drips into interest expense rather than forcing it [10]. On the evidence, the company can outlast a multi-year cost-trend problem without capital allocation being forced toward debt paydown: management explicitly frames only "some debt paydown" to nudge leverage toward its 40% target, not a wholesale pivot away from repurchases [11].
The repurchase record — executed, not authorized
This is the framework's central test, and it is where Cigna is strongest. Buybacks are actual cash out the door, visible on the financing line of the cash-flow statement: $3,621 million in 2025, $7,034 million in 2024 and $2,284 million in 2023 [12]. Over the decade the company has spent roughly $37 billion retiring stock.
Source: Consolidated Statements of Cash Flows, "Repurchase of common stock," FY2021–FY2025 10-Ks; figures match fit_features.share_count_trend.buyback_cash_per_year [13].
The result shows in the share count. Diluted shares fell from a post-Express Scripts peak of 379.8 million in 2019 to 268.6 million in 2025 — a 29% reduction, compounding at about −6.1% a year over the last five years [14].
Source: shares outstanding, FY2016–FY2025 10-Ks; matches fit_features.share_count_trend.per_year. The 2019 step reflects shares issued for the Express Scripts acquisition [15].
The hard-fail check passes. The framework fails outright any company whose share count keeps rising on stock-based compensation or serial acquisitions. Cigna's SBC is small — total share-based compensation cost was $291 million in 2025 (about 0.1% of the market capitalization) [16], a fraction of what is repurchased, so buybacks net comfortably against dilution and the trend runs down, not up. Prices paid have been reasonable relative to today's $284.85: the 20.9 million shares bought in 2024 cost about $335 each, near the middle of the drawdown, while 2025's purchases were spread across a year that traded from the mid-$240s to the low-$300s [17].
The authorization is real and funded, not a paper number: the Board added $6 billion in December 2024, bringing total repurchase authority to $10.3 billion as of December 31, 2024, and the program has no expiration date [18].
Management's buyback intent, from the calls
The record is matched by stated priority. Asked directly about capital deployment on the Q1 2025 call, David Cordani ranked the uses in order: "Priority one, support the ongoing growth of the business. Priority two, prudent deployment of capital for CapEx and innovation. Priority three, return excess capital to shareholders and/or pursue attractive M&A," adding that the company has "been meaningfully returning excess capital to shareholders through repurchase as well as an attractive dividend" [19].
On the 2025 outlook laid out in January 2025, management guided to roughly $10 billion of operating cash flow, about $1.4 billion of capital expenditure and $1.6 billion of dividends, with "a majority of proceeds" from the Medicare divestiture directed "toward share repurchase" and only "some debt paydown" to move leverage toward the 40% target [20]. The signal from both the words and the cash is that repurchases are the residual claimant on free cash flow, not debt reduction. The main tension a reader should weigh is that the M&A option in "priority three" competes with buybacks for the same dollars — the 2025 Shields investment, funded in part by a $2 billion term loan, is the recent example [21].
Insider buying alongside is thin but pointed: across 146 insider transactions on file, there was a single open-market purchase — outgoing CEO David Cordani bought 4,134 shares at $241.88 on November 3, 2025, days after the stock's October 2025 low near $244 [22]. It is a small sum, but it is a buy at the trough rather than a sale into strength.
The levered exception
The framework's tolerance for leverage — a ~25%-plus adjusted yield paired with a demonstrated multi-year share-count halving and non-deteriorating cash flow — is not the relevant test here. Cigna's adjusted yield sits near 11–12% (Yield), not the ~25% that opens that door, and its balance sheet is moderate rather than levered, so this is an ordinary balance-sheet case judged against the 10% bar, not the levered exception.
The absurdity check
The deterministic float_retirement_years feature is not_computable (it requires a positive latest adjusted-FCF figure the feature file could not assemble), so the arithmetic is shown here from the filed cash-flow statement. Reported free cash flow in 2025 was about $8.4 billion — $9,601 million of operating cash flow less $1,212 million of property-and-equipment purchases [23]. Subtracting SBC of $0.3 billion and modest bolt-on acquisition spend leaves adjusted free cash flow near $7.7–8.0 billion.
Source: market capitalization of $76.5 billion (268.6 million shares at $284.85, July 22 2026) divided by free cash flow; reported/adjusted FCF derived from the FY2025 cash-flow statement, consensus FCF from CapIQ estimates ($9.5B FY2025). float_retirement_years is not_computable in the feature file.
At today's price it takes on the order of eight to ten years of free cash flow to buy back the entire company. That is cheap for an essential, regulated, large-scale business — but it is not the ~3-year absurdity the framework flags at its extreme; Cigna is inexpensive, not priced for disappearance.
Dividend safety
The dividend is a minor part of the return, so it does not need to carry the case. The annualized payout of $6.24 (four times the $1.56 declared for the first quarter of 2026) is about a 2.2% yield on the current price; the quarterly rate has risen every year, from $1.23 in 2023 to $1.40 in 2024 and $1.51 in 2025 [24]. Coverage is heavy: $1,611 million paid in 2025 is roughly one-fifth of free cash flow, and the buyback — not the dividend — is the swing use of cash, so a cut would be a late rather than an early lever if cash generation deteriorated [25].
Management credibility
The promotional-CEO exclusion turns on promise-versus-delivery and skin in the game. On a sample of the five most material commitments from the 2024–2026 calls, the record is reliable with one clean miss.
Sources: guidance and outcomes from the Q2 2024 through Q1 2026 earnings calls [26] and the FY2025 10-K.
The one miss was the 2024 stop-loss shortfall: management reaffirmed at-least-$28.40 adjusted EPS in August 2024 [27] and came in at $27.33, describing it plainly on the January 2025 call — "we're disappointed by the shortfall that we reported in the fourth quarter" — rather than reframing it as a beat [28]. The 2025 guidance was then set, raised, and delivered — $29.84 against an initial at-least-$29.50 floor [29]. Candid misses and kept guidance are the opposite of the promotional pattern.
Insider economic ownership is modest but genuine and pay is performance-linked. Cordani's holdings, net of unvested restricted stock, represented 0.23% of shares outstanding at December 31, 2025 — roughly a $175 million stake — up 39% since year-end 2020, and he is required to hold Cigna stock worth at least eight times base salary, a threshold he exceeds [30]. About 92% of his 2025 target compensation was performance-based, and the 2023–2025 long-term award paid out at 73% of target on total shareholder return of −4.6% — compensation that moved down with the stock rather than a rubber stamp. No director or officer holds a controlling block; the largest holders are index managers (The Vanguard Group at 10.0% and BlackRock at 7.6% of shares outstanding) [31]. This is a professionally managed large-cap with aligned but not founder-scale ownership — no evidence of the big-claims, repeated-misses, low-ownership pattern the framework excludes.
Cigna's path back to recognition rests on a named, scheduled mechanism: the annual repricing of its stop-loss and individual-exchange books, the same books whose cost overrun drove the 2024 miss. Guidance was reset low and has since been beaten and raised five quarters running. This name's own modern drawdowns of comparable depth round-tripped in roughly 11 to 36 months. Long-dated listed options exist out to January 2028; 30-day implied volatility sat near 40% on 21 July 2026.
The re-rating mechanism
The dislocation traces to one identifiable cause with a scheduled fix. In the fourth quarter of 2024 Cigna reported a full-year medical care ratio of 83.2%, above its guidance range, "driven by higher-than-expected medical costs in our stop loss products" within Cigna Healthcare; management called it "short-term pressure" and said it was "taking corrective action to recapture margin" [1]. The medical care ratio then rose again in 2025, to 84.4%, a further 120 basis points, versus 81.3% in 2023 [2]. The margin has not yet bent; the recapture is a forward event, not a printed one.
What makes it a mechanism rather than a hope is the repricing calendar. Stop-loss and individual-exchange contracts reprice at each 1 January renewal. Management states the 2026 outlook "incorporates the pricing actions we've taken across stop loss and the individual exchange businesses," that within stop loss "pricing is tracking in line with expectations, and we've achieved rate increases consistent with our targets for improvement in 2026," and that the individual book has been "repriced for margin improvement" [3]. Stop-loss premium grew to $7.6 billion in 2025 from $6.7 billion, so the repriced book is large enough to move the segment ratio [4].
The catalysts, dated
The following are scheduled events, not sentiment. Each carries a date or a named window.
Sources: Q4 FY2025 call [5]; Q1 FY2026 call [6] [7]; earnings-date cadence and consensus path from CapIQ estimates, as reported.
Guidance reset against a low bar — the evidence it is in motion. The Q4 2024 print missed the street by 15%, the reset quarter [8]. Every quarter since has beaten. Cigna set its initial 2026 outlook at "at least $30.25" of adjusted EPS [9], then raised it after one quarter: first-quarter 2026 adjusted EPS of $7.79 was up 16% year over year, and management raised the full-year floor to "at least $30.35" [10].
Source: CapIQ/company earnings history — the −15.1% surprise is the 4Q24 reset; every quarter since has printed above consensus. Reported figures per company releases.
Buybacks shrinking the denominator. Capital deployment names share repurchase as a primary use of cash alongside the dividend and targeted M&A [11]. The share count fell to 268.6 million in fiscal 2025, a five-year compound decline of 6.1%, with $3.6 billion repurchased in 2025 alone. At a low-double-digit consensus free-cash-flow yield, retirement of stock adds to per-share earnings independent of the margin recovery. The willingness and prices paid are examined in Self-Help; here it is one lever of the re-rating, and it is already turning.
A feared event failing to happen. The pharmacy-benefit business sits under an industry-wide regulatory overhang — the sector faces litigation including from the Federal Trade Commission, documented across peer filings [12]. Cigna is pre-empting the model risk rather than waiting on legislation: it is moving Evernorth to a new cost-plus pharmacy model that goes live for external clients in 2028 [13], targeting at least half of pharmacy-benefit members for the transparent Signature model [14]. If PBM legislation or FTC action lands short of impairing Evernorth economics, the discount that overhang carries unwinds; this is the least dated of the mechanisms and the most contingent.
Base rates from Cigna's own history
The daily record runs from 1990. Across 36 years the stock has had two catastrophic drawdowns — roughly −73% into 2002 and −84% into the 2008 crisis — but both predate the modern company: the Express Scripts combination (2018) took revenue from about $40 billion then to roughly $275 billion now, so those episodes belong to a different business and are context, not a base rate. The relevant comparison set is the managed-care-scale era since 2015, when drawdowns of 28% to 43% have recurred.
Source: derived from The Cigna Group daily price history, 1990–2026 (run price data); peak-to-trough and top-to-bottom-and-back measured on closing prices. Current episode peak $366.85 (16 Sep 2024), trough $244.41 (31 Oct 2025), last $284.85 (22 Jul 2026).
Source: derived from the run's daily price history; the current episode has not yet round-tripped, so no bar is shown for it.
The arithmetic a skeptic can recompute: the four completed modern drawdowns round-tripped in 11.3, 14.2, 23.8, and 35.9 months — a median of about 19 months and a mean of 21 — and reached their troughs in 5.6 to 25.9 months (median about 11.5). Three of the four recovered fully within roughly two years; the exception, 2018–20, was extended because the COVID crash landed on top of an already-derating stock. The current −33.4% episode is well precedented in depth: 2015–16 (−31.7%) and 2022–23 (−28.5%) are close twins.
Two facts cut the other way and belong in the same breath. The current episode has already run about 22 months from its September 2024 peak with the price still 22% below it — past the name's median round trip, tracking the slower end. And the trough is only recently in (31 October 2025), so the recovery leg is roughly nine months old and 16% off the low; it is early, and the pace so far is below this name's own median.
The 18-month test
On the mechanism and the base rates together, re-recognition within roughly 18 to 24 months is a reasonable expectation rather than a multi-year cycle-repair problem: the trough appears to be in, the repricing is scheduled and its 2026 round is "tracking in line," guidance has been beaten and raised five straight quarters, and three of four comparable episodes in this name's own history round-tripped inside two years. The qualifier, stated once: this episode has already run slower than the median and the decisive proof — the Cigna Healthcare medical care ratio actually bending — has not printed; the 2025 ratio rose rather than fell [15]. What would falsify the read is the repricing cycle failing to fire — the medical care ratio holding elevated or rising through 2026 instead of bending as stop-loss and individual rate actions earn in. That falsifier ties to the industry-repricing seed in the Fit ledger and to the drawdown anatomy in Dislocation.
What consensus expects, and when
The sell side is not capitulated — it is constructive, and already ahead of the price. Twenty of 24 analysts carry a buy or outperform rating and none a sell, a consensus recommendation score of 1.5 on a scale where 1 is the most bullish. The mean price target is $340.92 and the median $340, against a last close of $284.85; even the low target of $290 sits above the current price, and the high is $400.
Spot (22 Jul 2026)
Mean target
Implied to mean target
Source: consensus targets (CapIQ, 24 estimates) and run price data, as reported.
Source: consensus targets and recommendations (CapIQ, 24 estimates), as reported; spot from the run's price data (22 Jul 2026).
That positioning matters for the framework's own consensus check: this is not a name where the sell side has thrown in the towel and only the buy side is scared. Both the sell-side targets and consensus free-cash-flow expectations (examined in Yield) sit above the price, which reads as a milder dislocation than the framework's canonical forced-selling setup.
When does consensus expect the recovery to print? The quarterly path shows it is already partly visible — the last five quarters beat — but the earnings re-acceleration is a 2027 event. Consensus adjusted EPS is roughly flat in 2026 (about $30.4, the reset year) and steps up about 10% to $33.5 in 2027, then to $37.0 in 2028.
Source: FY2024–FY2025 reported adjusted EPS per company releases; FY2026–FY2028 consensus means (CapIQ), as reported.
The candidate quarter for the re-rating, then, is not a single date but a sequence: the 2026 prints (the next is Q2 FY2026, historically the last week of July) that would show the medical care ratio bending, followed by the FY2027 numbers where consensus itself pencils the return to double-digit growth. A re-rating usually needs a printed quarter; here the printed proof of margin recapture, as distinct from EPS growth carried by Evernorth, is what the 2026 quarters are being watched for.
The instrument facts
These are facts about the listed instruments, stated as facts. Nothing here is a recommendation, and no strike, expiry, or structure is named as a suggestion.
Long-dated listed options exist on Cigna. As of mid-2026, standard listed expiries extend to January 2028 — on the order of 18 months out — comfortably inside the framework's preference for tenors of a year or more [per Nasdaq's options-listing notice, "January 2028 Options Now Available For The Cigna Group (CI)"]. As a roughly $77 billion NYSE large-cap, the name carries a liquid, actively quoted options market across monthly and long-dated (LEAP) chains; at a high level, liquidity is not a constraint at these tenors.
The current implied-volatility level, from a dated source: Cigna's 30-day mean implied volatility was 39.9% as of 21 July 2026 (calls 39.2%, puts 40.6%), per AlphaQuery's option-statistics page. That sits below the framework's ~50–55 reference line — moderate, not elevated (the 60–70 band would be elevated). Consistent with that, the stock's five-year beta was 0.30 as of 22 July 2026 per stockanalysis.com, a low-beta profile for a company of this scale.
Because qualifying long-dated options do exist here, the framework's watchlist-only carve-out — the case where a name would otherwise qualify but has no long-dated instruments to express it — does not apply to Cigna on instrument grounds. That is a framework fact about instrument availability, not a judgment on the name.